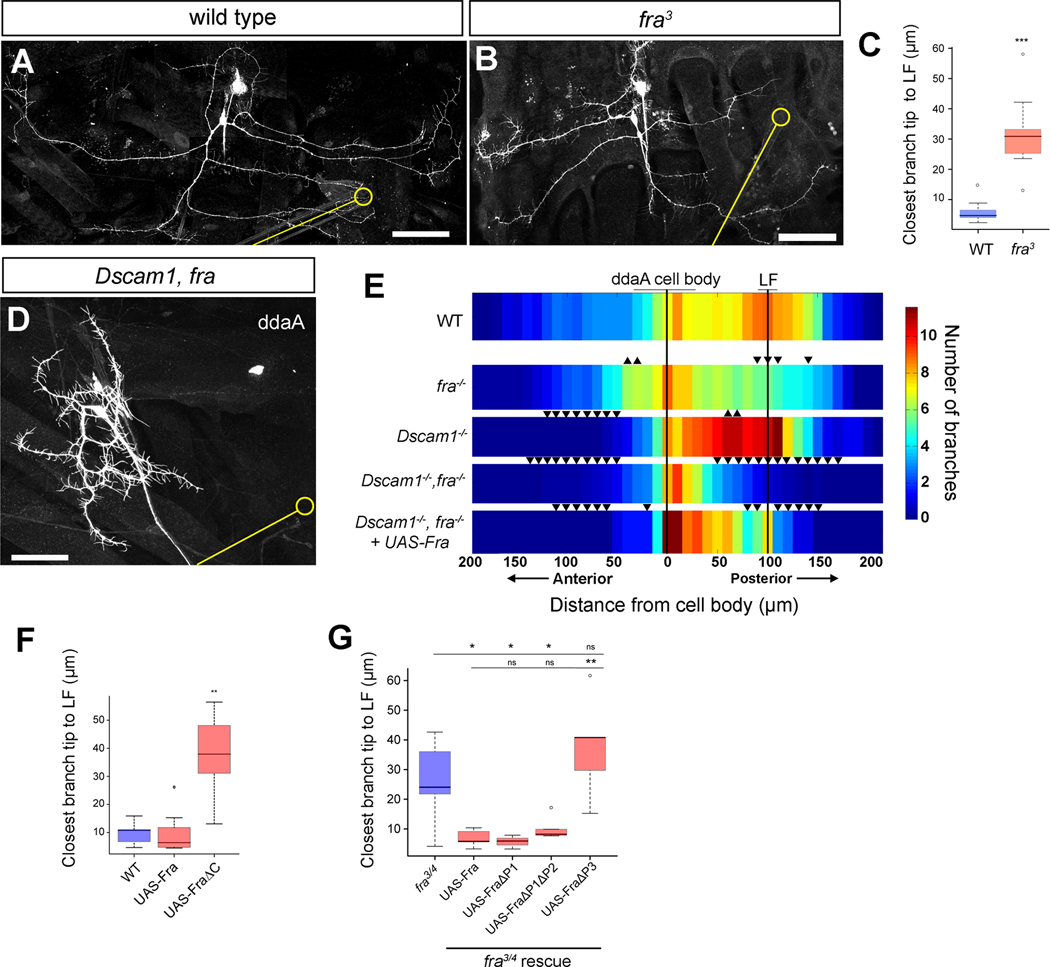
Figure 2. Frazzled is required for sensory neuron dendrite targeting.
(A) A wild-type MARCM ddaA neuron showing targeting of branches to the chordotonal organ. The chordotonal organ and LF are indicated by a yellow line and yellow circle, respectively in this, and subsequent, panels.
(B) A fra3 MARCM clone of ddaA showing disrupted targeting to LF.
(C) Plot of the distance of the closest branch tip to LF in wild-type (WT, n=8) and fra3 (n=9) mutant clones.
(D) Dendrites of Dscam121, fra4 double mutant MARCM clone lack enrichment of dendritic termini at LF, and show extensive dendritic clumping near the cell body.
(E) Horizontal Sholl analysis showing mean branch density values at 10μm intervals for wild type (n=8), fra (n=8), Dscam1 (n=5), Dscam121, fra4 (n=14) and Dscam121, fra4 + UAS-Fra (n=6) MARCM clones of ddaA. Upwards-pointing arrowheads denote significant increase in branch density relative to control (p < .05), while downwards-pointing arrowheads denote significant decrease in branch density (p < .05) as compared to topmost control strip.
(F) Quantification of the single closest branch tip to LF in control (n=8), UAS-Fra (n=7), and UAS-FraΔC (n=6) FLP-out clones reveals no effect of UAS-Fra on targeting, but a disruption of targeting caused by UAS-FraΔC. The pan-da neuron driver 109(2)80-Gal4 was used in these experiments.
(G) Quantification of closest branch tip to LF in FLP-out rescue experiments in fra3/fra4 mutant (n=9) background. Introduction of UAS-Fra (n=5), UAS-FraΔP1 (n=3), UAS-FraΔP1ΔP2 (n=5) significantly rescues the targeting defect seen in fra3/fra4 mutant larvae, while introduction of UAS-FraΔP3 (n=5) does not. 109(2)80-Gal4 was used as a driver in these experiments.
Datasets are presented in boxplots as median (thick line), quartiles Q1–Q3 (25%–75% quantiles; shaded box), and data in 1.5× quartile range (dashed bars). Data points outside these ranges are indicated as open circles. In (E), * = p < .05 by Wilcoxon rank-sum test (no further delineations of significance are presented for clarity of presentation).
* = p < 0.05; ** = p < 0.01;*** = p < 0.001 by Wilcoxon rank-sum test.
All scale bars = 50μm
See also Supplemental Figure S2

