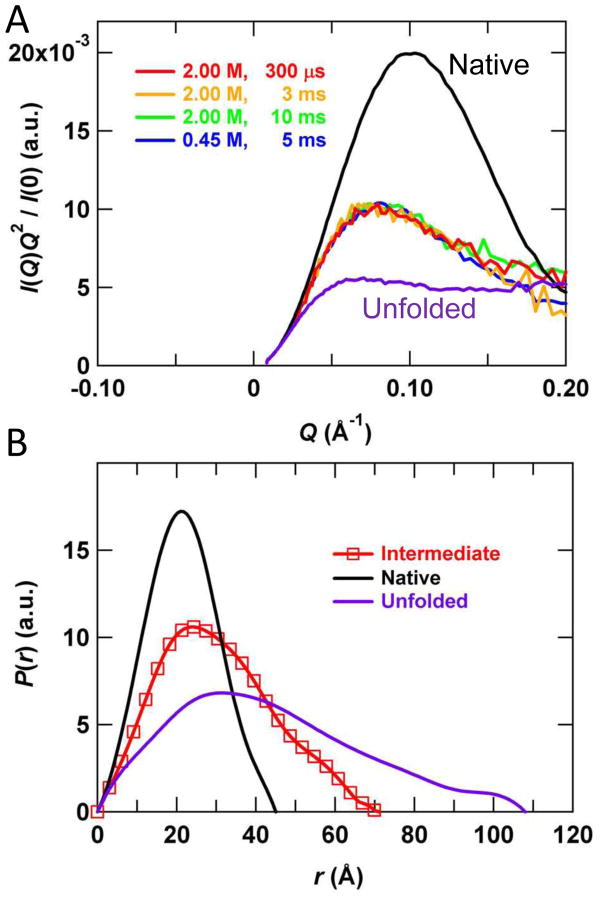
Figure 3.
Representative continuous-flow SAXS data. Refolding of dihydrofolate reductase following a 4.5 M to 0.45 M urea jump is shown at a final protein concentration of ~1 mg/mL. Each scattering curve corresponds to approximately 15×1s images acquired at a final flow rate of 20 ml/min in a 200×350 μm2 flow channel. Although the sample consumption corresponding to this acquisition time is relatively modest (20 ml/min × 1 mg/ml × 15×1 s=5 mg), the duty cycle of the experiment is <10%, requiring >50 mg for each point. Future optimizations are expected to bring the duty cycle to >95%. The figure is reproduced from Reference 30, with permission.

