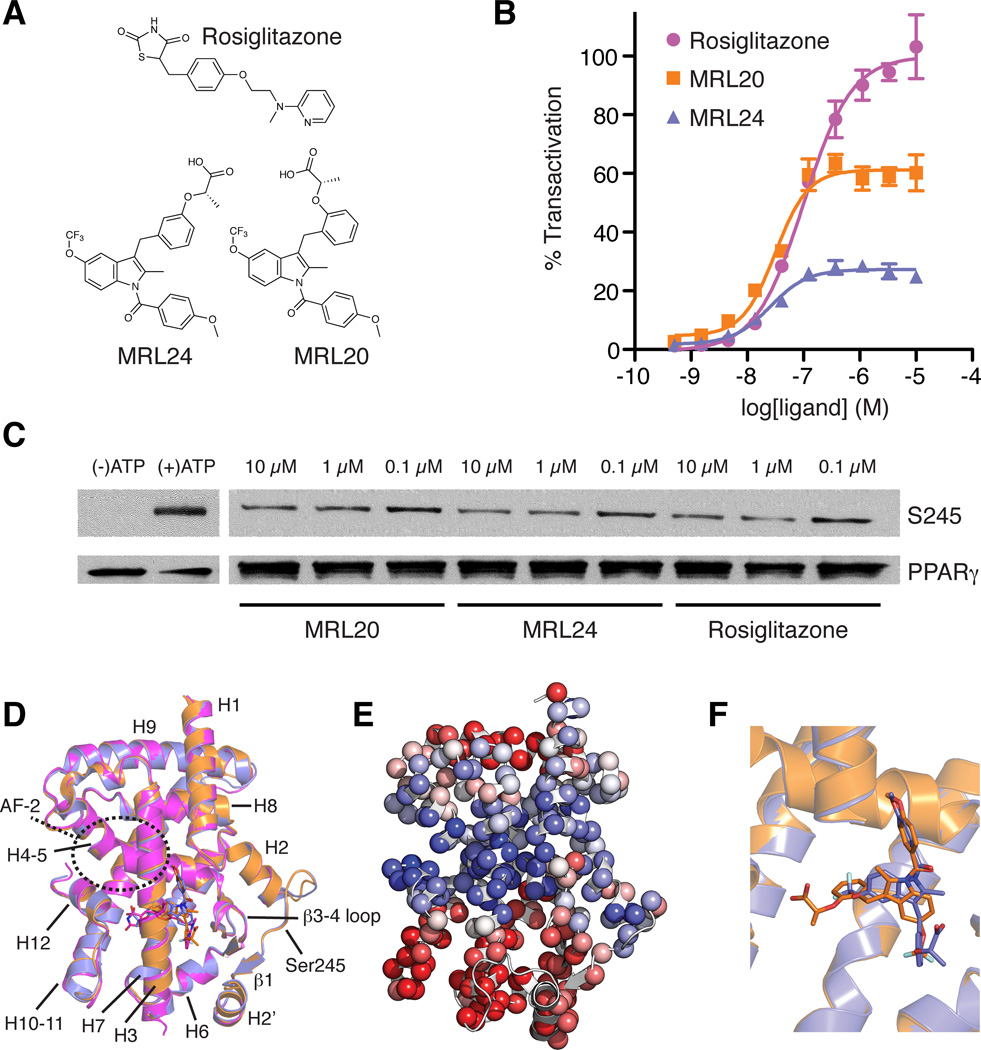
Figure 1. Graded response of PPARγ ligands is not explained by ligand-receptor crystal structures.
(A) Chemical structures of rosiglitazone, MRL20 and MRL24. (B) Effect of ligands on PPARγ transactivation in a cotransfection assay in 293T cells using a Gal4-PPARγ expression vector and UAS-luciferase reporter (n=4). (C) In vitro biochemical assay showing the ability of PPARγ ligands studied to block Cdk5-mediated phosphorylation of PPARγ. (D) Cartoon diagram overlay of PPARγ LBD crystal structures bound to rosiglitazone (pink; PDB 2PRG), MRL24 (blue; PDB 2Q5P) and MRL20 (orange; PDB 2Q59). (E) The first principal component from the THESEUS (Theobald and Wuttke, 2006, 2008) correlation matrix for the ML superposition of the structures in (D) mapped onto the PPARγ LBD (PDB 1FM6). Regions colored similarly (red or blue) are self-correlated, whereas regions colored differently (red versus blue) are anti-correlated. (F) PPARγ LBD structures bound to MRL24 (blue; PDB 2Q5P) and MRL20 (orange; PDB 2Q59) illustrate these structurally similar ligands bind in distinct ligand conformations under the crystallization conditions (Bruning et al., 2007).

