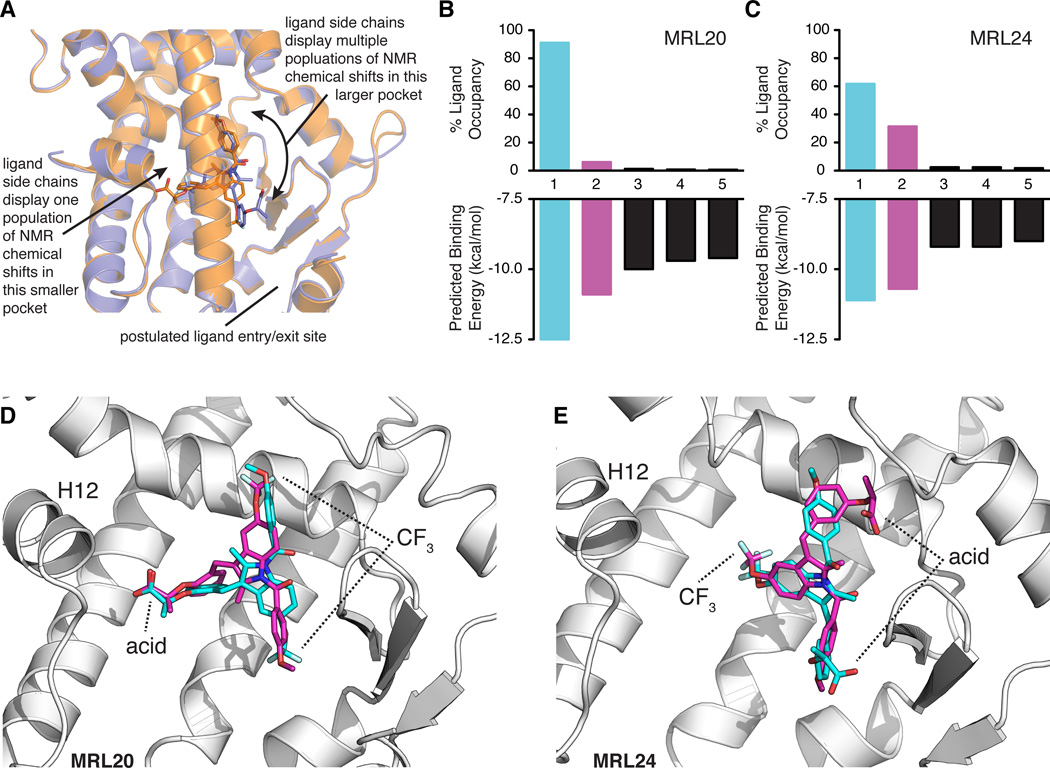
Figure 5. Model of MRL20 and MRL24 ligand dynamics within the ligand-binding pocket and corroboration via ligand molecular docking.
(A) The ligand-observe NMR data suggest that the acid and nearby methyl groups of MRL20 and the CF3 group of MRL24 bind in the same smaller pocket within the PPARγ LBP. In contrast, the region of the LBP where the other ligand side chains associate constitutes the largest cavity within the LBP, and NMR resonances corresponding to the ligand atoms in this region display multiple populations. This suggests the ligands sample multiple conformations/binding modes in this region of the LBP and is supported by protein NMR studies indicating multiple receptor conformations (Figure 3). (B–C) Average predicted binding energies and % ligand occupancy according to the canonical Boltzmann distribution from the molecular docking of MRL20 (B) and MRL24 (C). Data for the primary and secondary modes are colored blue and pink, respectively. (D–E) Primary (blue) and secondary (pink) binding modes obtained in the molecular docking results for MRL20 (D) and MRL24 (E). Primary binding modes (blue) closely match the binding mode captured in PPARγ crystal structures (Bruning et al., 2007), whereas the secondary binding modes (pink) display a ligand orientation flipped ~180° relative to the primary orientation in a manner concordant with our NMR data (A; Figure S4)

