
Figure 5.
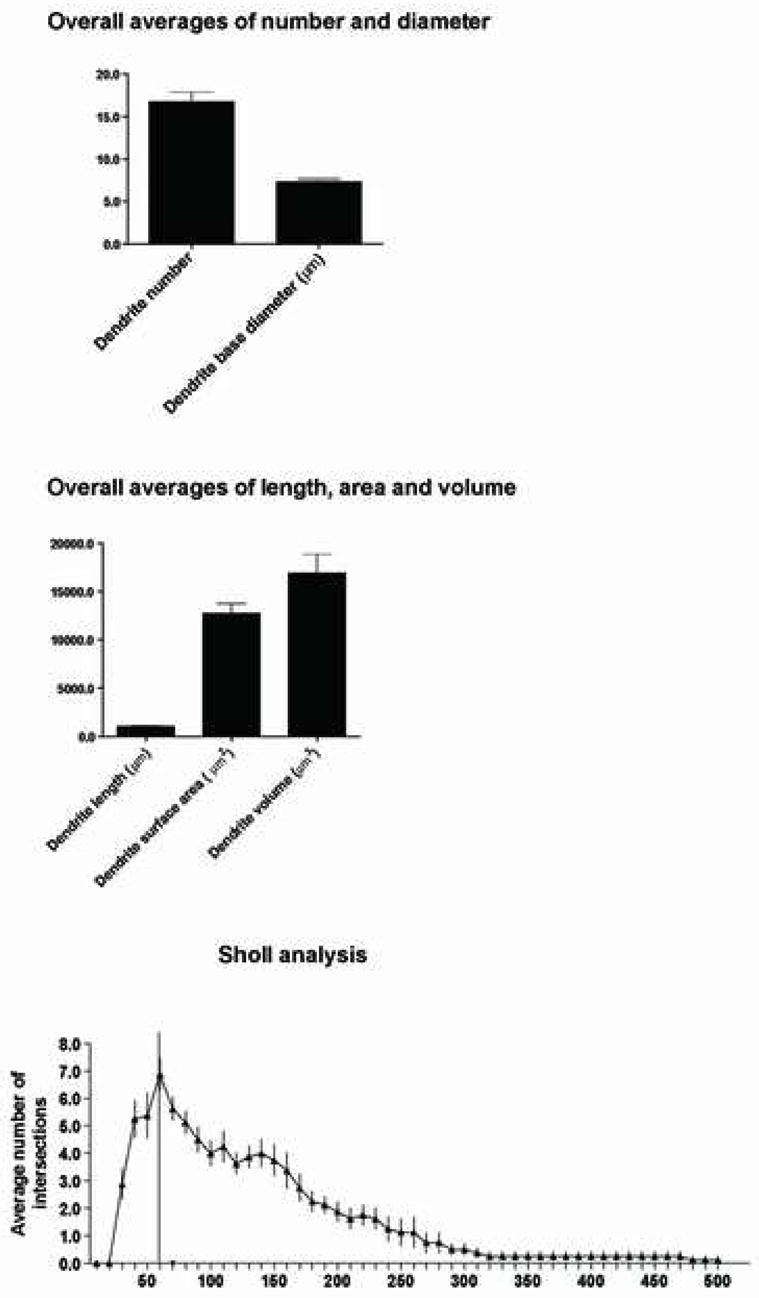
Quantitative analysis depicting the mean values of the dendritic segment number and diameter (top), dendritic length, area and volume (middle), and the Sholl analysis (bottom) obtained from the evaluation of the 8 best-filled OO motor neurons. Error bars represent the SEM.