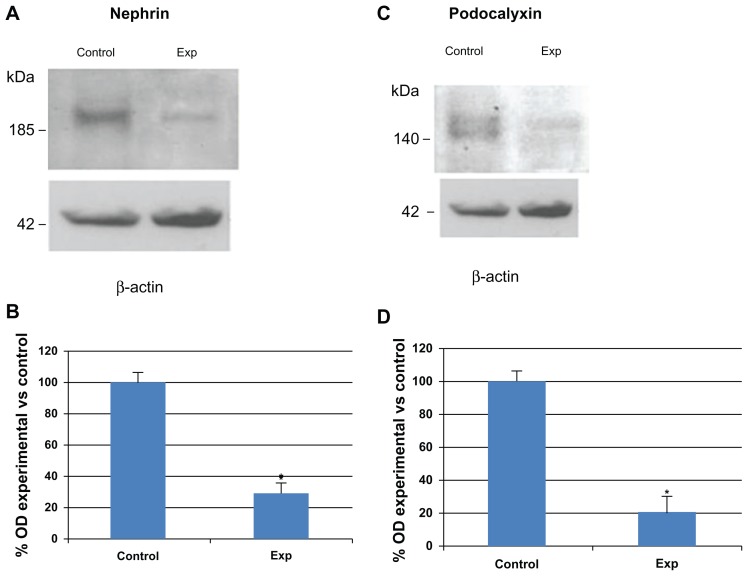
Figure 5.
Nephrin and PC immunodetection by Western blot in renal cortex. (A) representative blots of nephrin; (C) representative blots of PC; (B and D) bar graphs representing average protein levels normalized to the internal control β-actin. Note that the 185 kDa band corresponding to nephrin and the 140 kDa band corresponding to PC were decreased in sStx2-treated rats as compared to controls.
Abbreviations: sStx2, supernatant Shiga toxin type 2; PC, podocalyxin.

