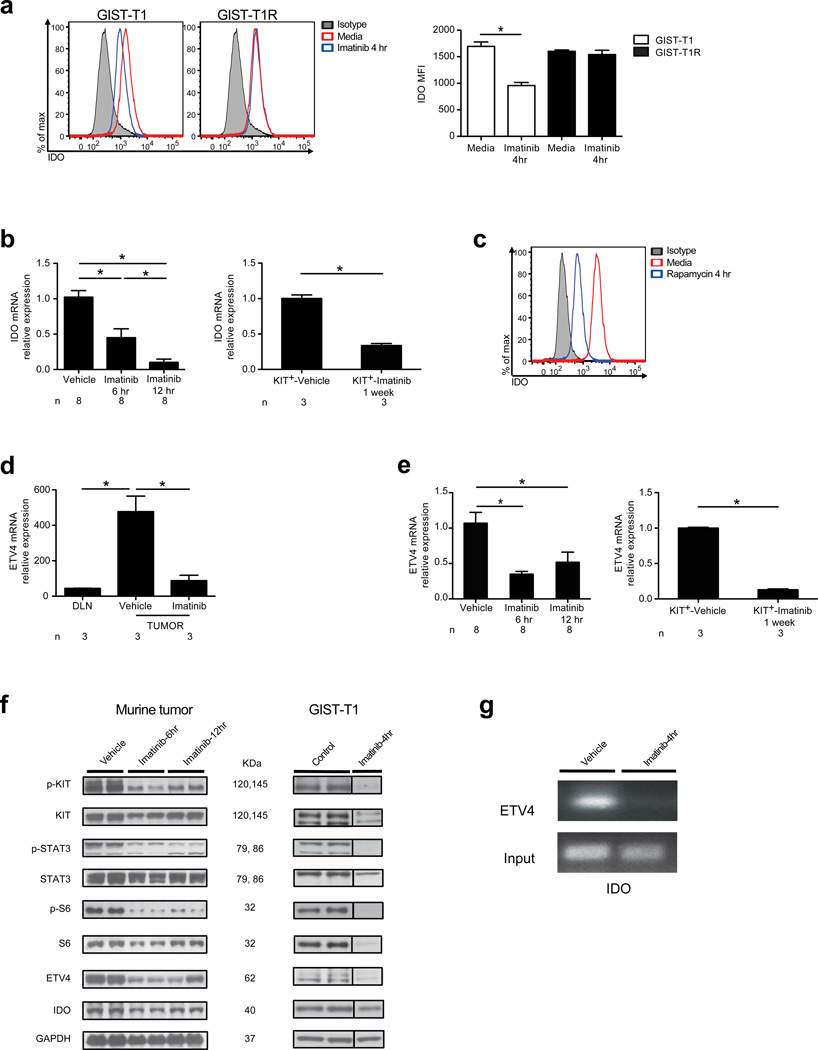
Figure 4. Imatinib reduces IDO expression through inhibition of oncogenic KIT signaling.
(a) IDO in GIST-T1 and GIST-T1R cells. (b) Ido mRNA in mouse GIST tumors (left panel, n = 8 per group) and sorted Kit+ tumor cells (right panel, n = 3 per group shown relative to internal controls) after treatment with vehicle or imatinib. (c) Intracellular IDO in GIST-T1 cells after culture in rapamycin. (d) Etv4 mRNA in the DLN and tumor determined by microarray analysis from GIST mice after vehicle or imatinib treatment for 7 d. n = 3 per group shown relative to internal controls. (e) Etv4 mRNA in mouse GIST tumors (left panel, n = 8 per group) and sorted Kit+ tumor cells (right panel, n = 3 per group) after treatment with vehicle or imatinib. (f) WB of KIT, ETV4, and IDO in GIST mice (left panel) and GIST-T1 cells (right panel) after treatment with vehicle, control, or imatinib. Both phosphorylated and non-phosphorylated KIT, STAT3, and S6 are shown as components of oncogenic KIT signaling. IDO in GIST-T1 cells was detected via immunoprecipitation. (g) Chromatin immunoprecipitation (ChIP) was performed on GIST mice treated with vehicle or imatinib in vivo (n = 3 per group). In vitro culture experiments were performed with 1 µM imatinib. Data in (b) and (e) were normalized to internal controls and are shown relative to vehicle treatment. Data represent means ± s.e.m. with n as indicated above, or triplicate wells analyzed individually and representative plots are shown. *P < 0.05.

