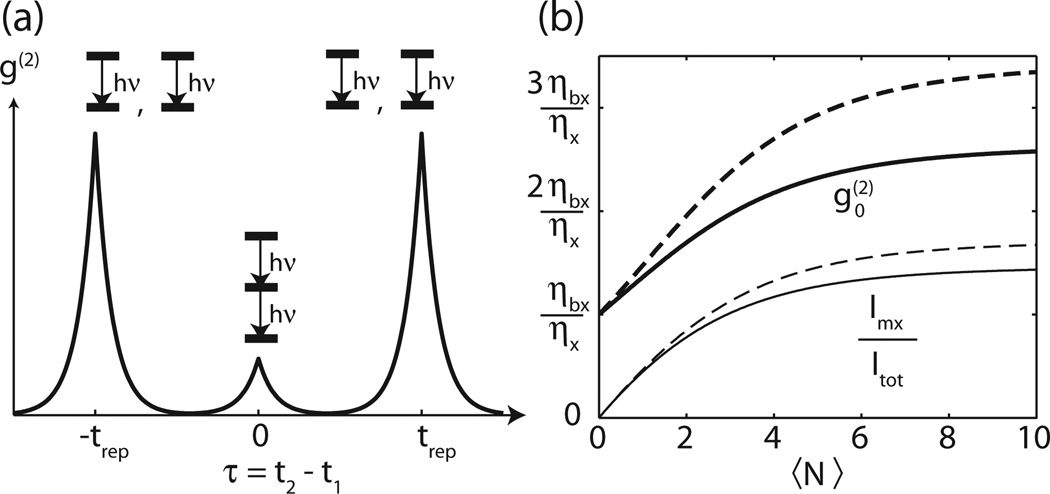
Figure 1.
(a) Schematic illustrating the main features of g(2) (τ) on a single colloidal nanocrystal under pulsed excitation with repetition rate . The shape of the center and the side peaks is the same because the distribution of the time differences between BX,X photons and the time differences between consecutive X,X photons are both defined only by the X lifetime. (b) Calculation of the excitation power dependence of , the ratio of the center to +trep integrated peak areas, and Imx/Itot, the fraction of the total emission intensity due to multiexcitons, for a CdSe-like NC. The calculated result is plotted in units of ηbx/ ηx, the ratio of the biexciton to exciton fluorescence quantum yields. 〈N〉 is the average number of photons absorbed. Solid curves are for the case where ηbx/ηx = 0.1 and the dashed curve represents the case where ηbx/ηx → 0. A simple Auger decay scaling model described in detail in the Supplementary information was used to approximate values for the quantum yields of higher multiexcitons based on the assumed ηbx. For small 〈N〉, grows linearly from its ηbx/ηx intercept and then saturates at high powers owing to the diminishing quantum yield of higher multiexcitons.

