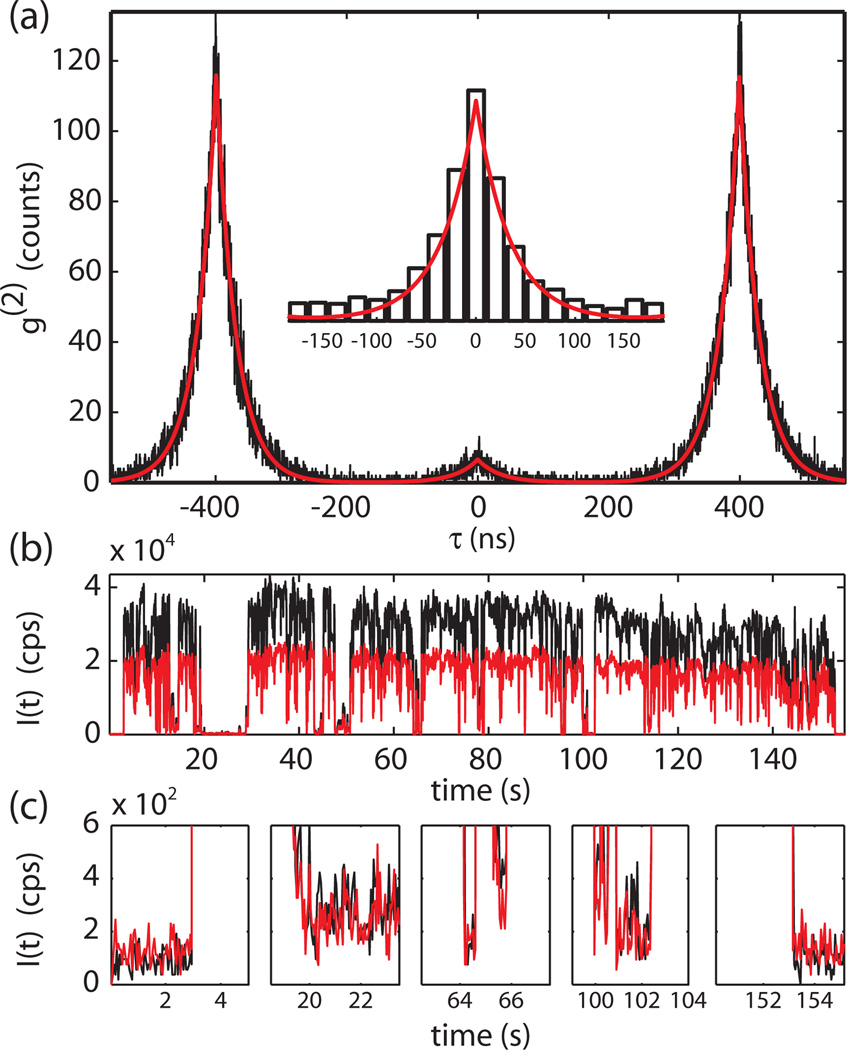
Figure 2.
(a) Measured, unnormalized g(2) (τ) from a single CdSe/CdZnS NC under ≈ 12 µJ/cm2 pulsed excitation, representative of the 〈N〉 ≪ 1 limit. The normalized integrated area of the center feature, = 0.06, is a direct measure of the BX to X quantum yield ratio of this NC. Inset is a 20ns-binned detail of the center peak. Red lines are a fit to the sum of three two-sided exponentials. (b) Time traces of intensity in start and stop channels (black and red) during the g(2) acquisition. (c) Details showing off-state intensities. The events in the first and last panel correspond to switching the excitation laser on and off.

