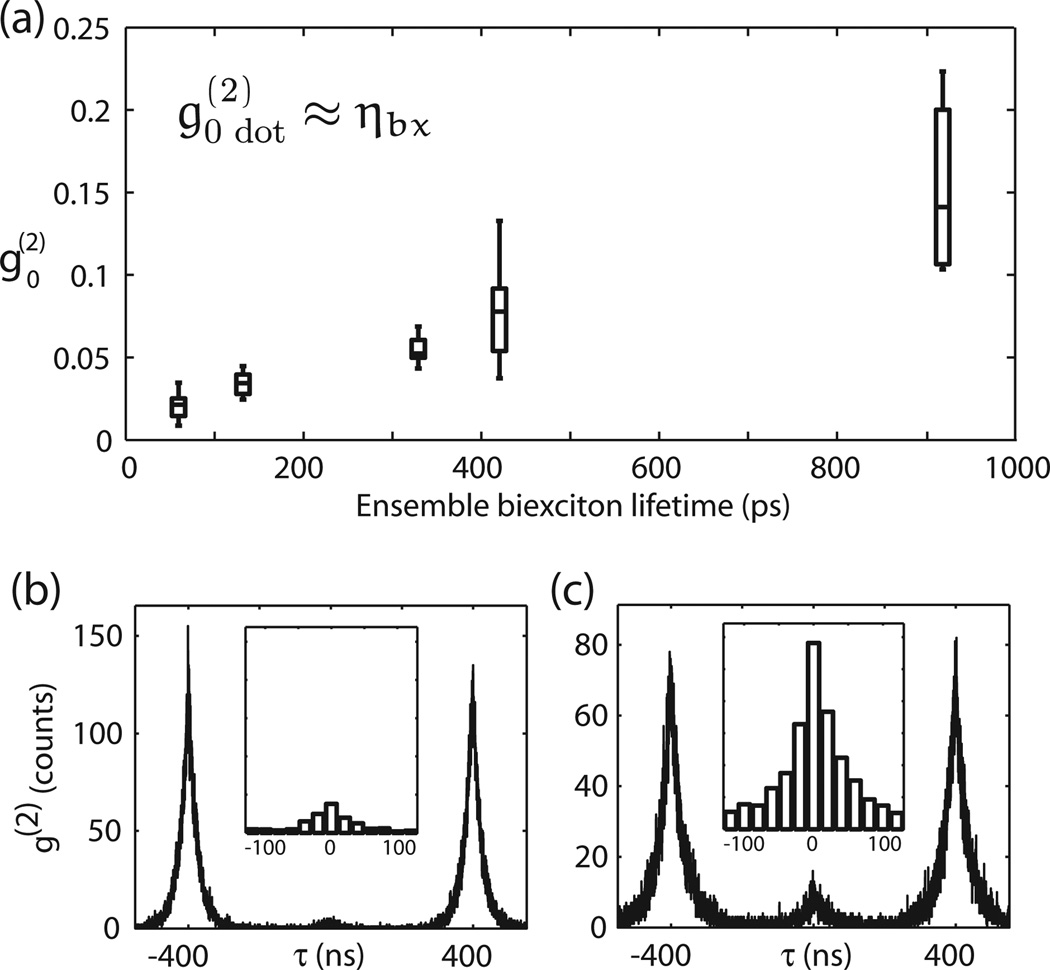
Figure 3.
(a) Box and whiskers plot of our measured values of on several individual NCs from five different samples plotted against each sample’s ensemble biexciton lifetime. The box edges indicate the first and third quartiles, the line within indicates the median value, and the external lines the minimum and maximum. For a colloidal, digitally blinking, CdSe-based NC, ≈ 1 so ≈ ηbx. (b) Raw g(2) data of an NC from the sample with the shortest BX lifetime. In this case = 0.021%. Inset shows a 20ns-binned detail of the center feature. (c) Same as (b) but for an NC from the sample with the longest BX lifetime, showing = 0.128.

