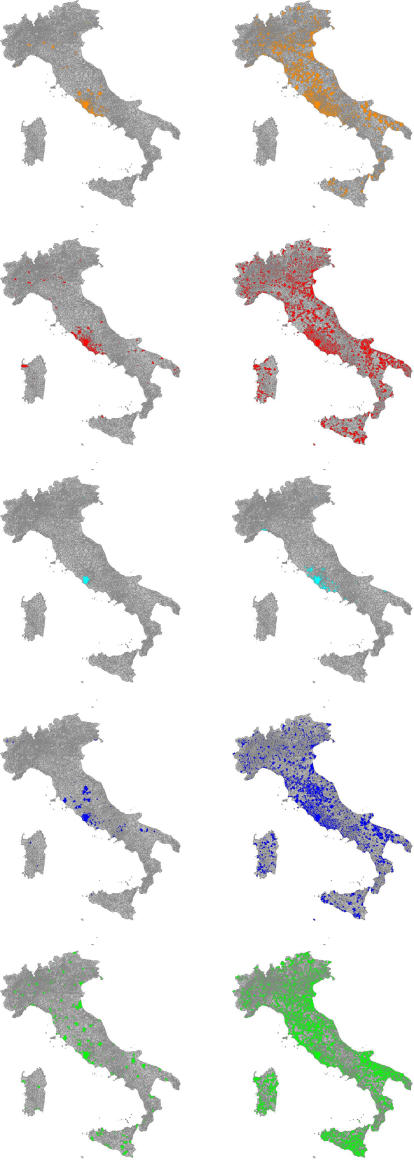
Figure 3. Spatiotemporal dynamics at 40 (on the left) and 60 (on the right) days, roughly corresponding to the begin and the end of the exponential growth phase. Infection is seeded in Rome and G0 = 1.7.
Colored areas (model M in orange, M+T in red, L in cyan, L+T in blue, and S in green) indicate presence of at least one infected, infectious or removed individual.

