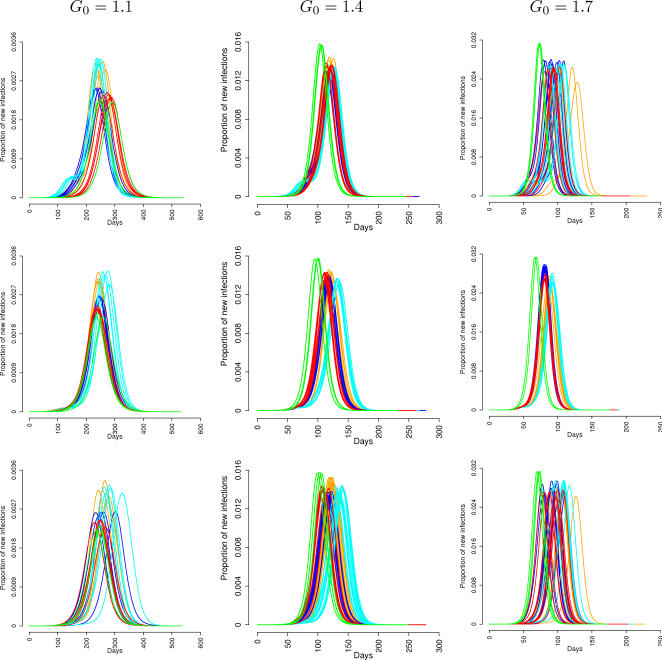
Figure 4. Number of daily cases for different values of the first generation index and different seeding municipalities: Rome (first row), Cagliari (second row), a small isolated village in the north of Italy (third row).
Simulation are initialized with 30 infected individuals, to reduce the stochastic variability observed in first days of the epidemic. Models are: M in orange, M+T in red, L in cyan, L+T in blue, and S in green.

