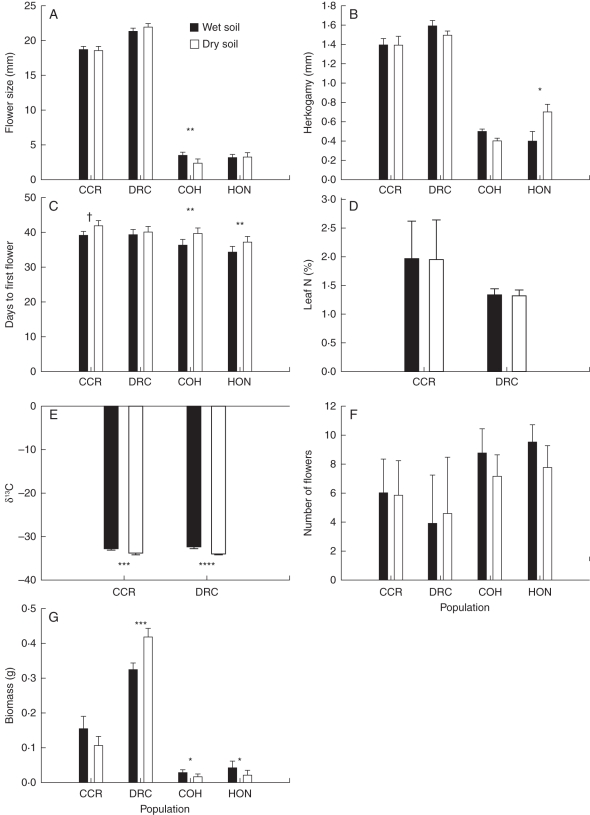
Fig. 2.
Least-squares means (±s.e.) of flower size (A), anther–stigma separation (B), days from sowing to first flower (C), leaf %N content (D), leaf 13C isotope ratio (E), number of flowers produced (F) and above-ground biomass (G) in greenhouse populations of Mimulus guttatus (CCR and DRC) and M. nasutus (COH and HON) grown in experimentally dry and wet soil, as indicated. †P < 0·1, *P < 0·05, **P < 0·01, ***P < 0·001, ****P < 0·0001 in mixed-model ANOVA comparisons of trait means between treatments within populations.

