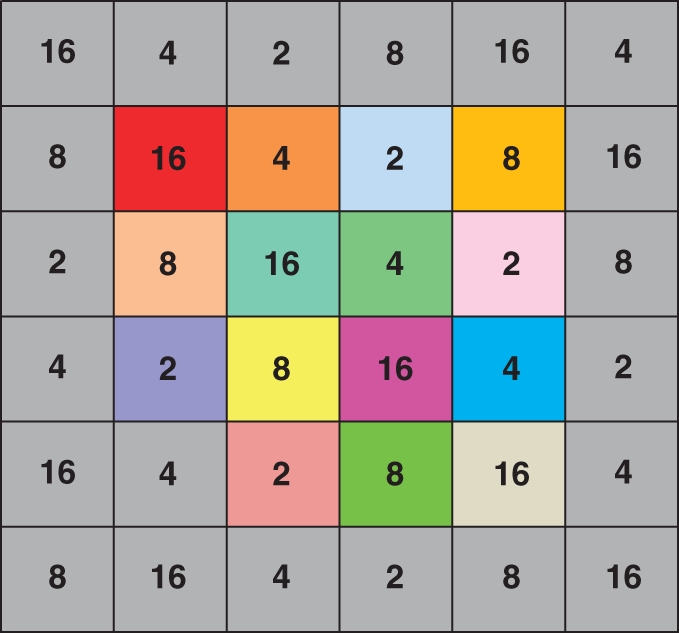
Fig. 1.

Arrangement of genets and floral display size treatments in one of the four experimental arrays. Numbers indicate the floral display size treatment for each spatial position. Colour indicates the genetic identity of individual plants. The 15 brightly coloured locations in the centre of the array represent single ramets of 15 genetically distinct individuals. The grey locations on the border, and at the lower left corner, of the central 4 × 4 square indicate multiple ramets of border genet ‘D’. Note that each central plant is surrounded by two plants with each of the floral display treatments. Therefore, each central plant has an equivalent neighbourhood in terms of display size.
