
Fig. 4.
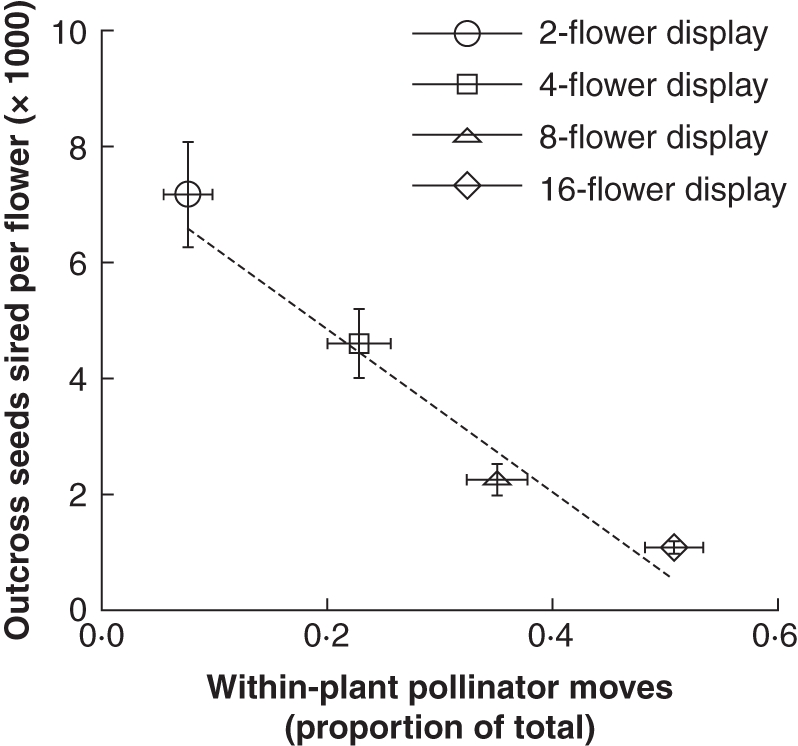
Effect of geitonogamous pollinator movements on outcross siring success per flower (mean ± s.e.) for plants in each floral display size treatment; n = 66–189 plant visits per data point for the x-axis, n = 15 plants per data point for the y-axis. Dashed line represents a linear regression fitted to the means.