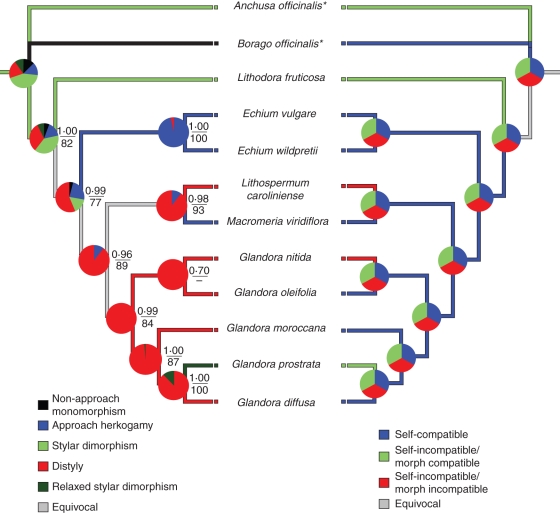
Fig. 2.
Evolution of sexual polymorphisms and incompatibility systems within some genera of Boraginaceae, based on the majority-rule consensus tree recovered from the Bayesian analysis of the combined ITS and trnLUAA intron data set. Numbers above branches on the left tree indicate posterior probabilities from the Bayesian analysis under the GTR + G model. Numbers below branches are bootstrap values from the MP analysis. The most-parsimonious states are shown under the unordered model (coloured lines of the tree). For the ML character reconstruction, probabilities at each node are reported as proportional likelihoods for each character (sectors of the pie charts).

