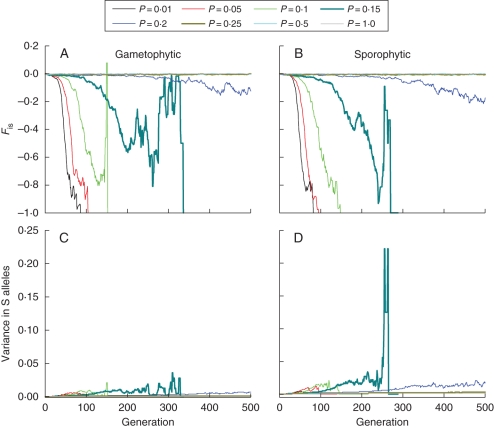
Fig. 6.
Temporal changes in the inbreeding coefficient (FIS) and variance in S-allele richness for populations initiated with 20 S alleles for a range of different pollination probabilities (P = 0·01 to P = 1·0): (A, B) show results for FIS for gametophytic and sporophytic self-incompatibility systems, and (C, D) show results for variance in S-allele frequency. All data represent mean observed parameter values based on 100 independent simulation runs.

