Figure 3.

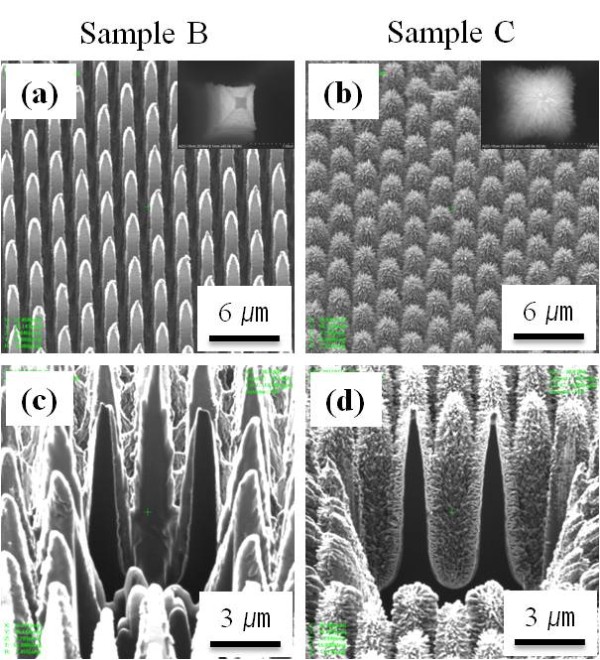
FIB SE images of sample B and sample C. (a, b) Before ion beam sputtering and (c, d) after ion beam sputtering. The insets in figure manifest the high-magnification image of the single SiMW of each sample.

FIB SE images of sample B and sample C. (a, b) Before ion beam sputtering and (c, d) after ion beam sputtering. The insets in figure manifest the high-magnification image of the single SiMW of each sample.