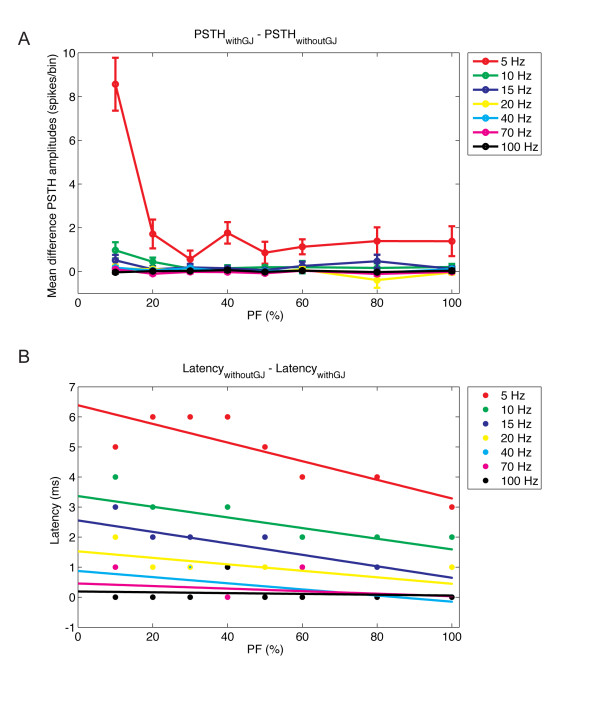
Figure 11.
Quantification of the robustness effect of gap junctions. (A) Mean difference in population spike timing histogram (PSTH) amplitudes (spikes/bin) in the Golgi cell (GoC) layer with or without gap junctions for different strengths of parallel fiber (PF) connections and mossy fiber (MF) input rates. The mean and standard deviation were obtained from the amplitude of the oscillation cycles occurring within the interval of 1000 to 2000 ms. (B) Difference between the latency (ms) for the occurrence of the first oscillatory cycle after MFs were turned on in the network without or with gap junctions.

