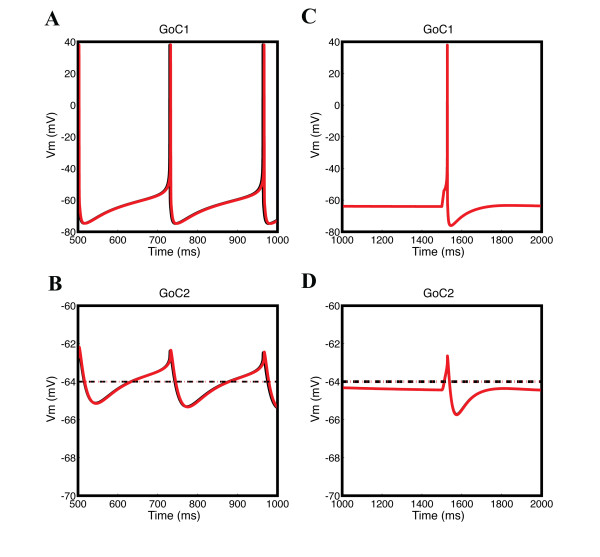
Figure 3.
Electrical coupling between two Golgi cells (GoCs) connected by gap junctions either on the soma (red) or on the dendrite (black). Membrane potentials recorded from the soma of two gap junction-coupled GoCs in response to either (A, B) mossy fiber (MF) synaptic input at 10 Hz or (C, D) to a depolarizing current pulse. GoC1 and GoC2 were coupled by gap junctions either on the soma (red) or in the dendrite (black). (A, C) On the top, GoC1 is spiking and transmits to (B, D) thenon-spiking GoC2 below. In (C), pacemaker firing in GoC1 was suppressed with a hyperpolarizing current of -0.1 nA and a spike was evoked by a 100 ms pulse of 0.5 nA at 1500 ms. The spikes of GoC2 were always suppressed by setting all the sodium channel conductances to zero. Note (B, D) that the fast components of the spike (rising phase, peak and falling phase) are filtered more than the slower ones (undershoot), and that gap junction location does not matter much (red and black curves are superimposed). Dotted lines indicate the GoC resting membrane potential.

