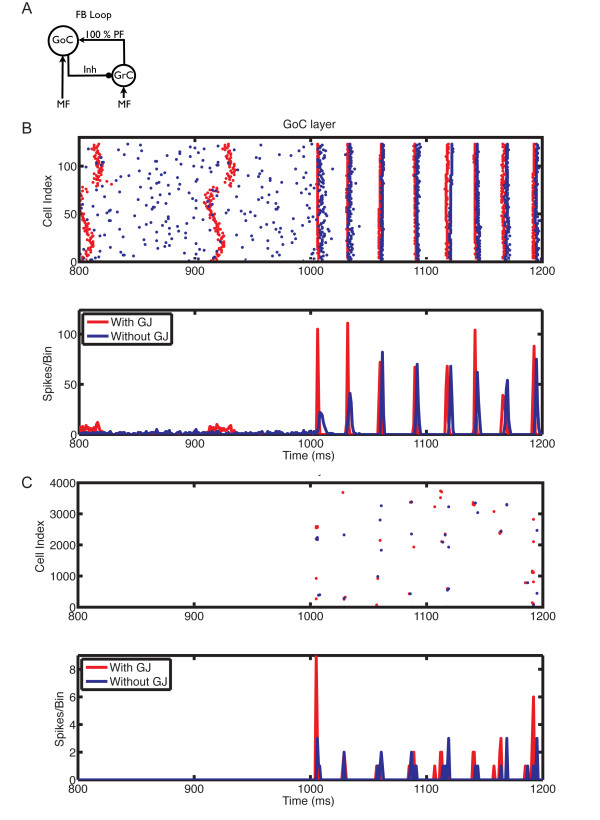
Figure 8.
The influence of gap junctions between Golgi cells (GoCs) on the responses of the network in the feedback loop configuration, with mossy fiber (MF) input at 5 Hz. (A) Feedback loop configuration: network with strong PF inputs and 100% synaptic weight. (B) Raster plot (top panel) and population spike timing histogram (PSTH) (bottom panel) of the GoC layer with (red) and without (blue) gap junctions. Each dot in the raster plot is a spike. MF mean firing rate (MFR) inputs at 5 Hz were turned on at the instant of 1000 ms. (C) Same as (B) but for the GC layer.

