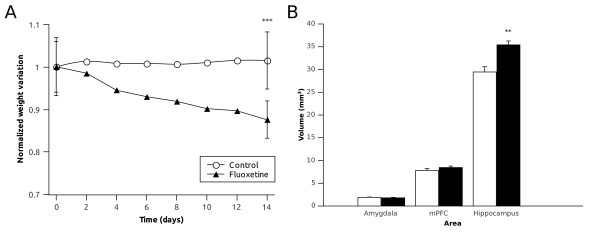
Figure 1.
Graphs showing (A) the body weight change through the experiment for the control and fluoxetine group and (B) the effect of the chronic fluoxetine treatment on the volume of the different structures studied. Statistically significant (* P < 0.05, ** P < 0.01, *** P < 0.001) Student t-test.

