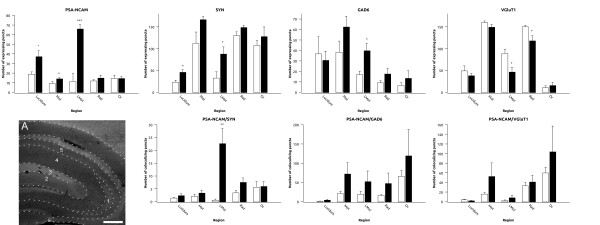
Figure 5.
Graphs representing the expression of puncta for the different markers and its colocalization in different areas of the hippocampus. White bars represent control animals and black bars represent fluoxetine treated animals respectively. A is a focal plane showing the expression of PSA-NCAM in the strata (1) Lucidum, (2) Molecular, (3) Lacunosum Moleculare, (4) Radiatum and (5) Oriens of the hippocampus. Scale bar: 200 μm.

