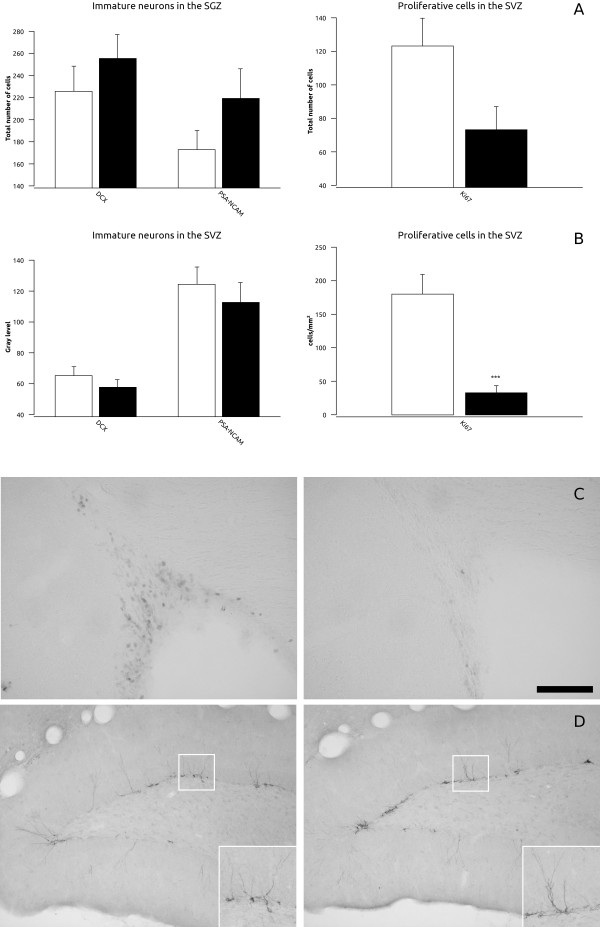
Figure 6.
Graphs representing (A) the total number of cells expressing immature and proliferative markers in the subgranular zone (SGZ) of the hippocampus and (B) the gray level of doublecortin (DCX) and PSA-NCAM and the density of Ki67 in the subventricular zone (SVZ). White bars represent control animals and black bars represent fluoxetine treated animals respectively. (C) Micrographs showing the expression of Ki67 in the SVZ and (D) DCX in the SGZ. Scale bar: 100 μm (C and D) and 50 μm (insets in D).

