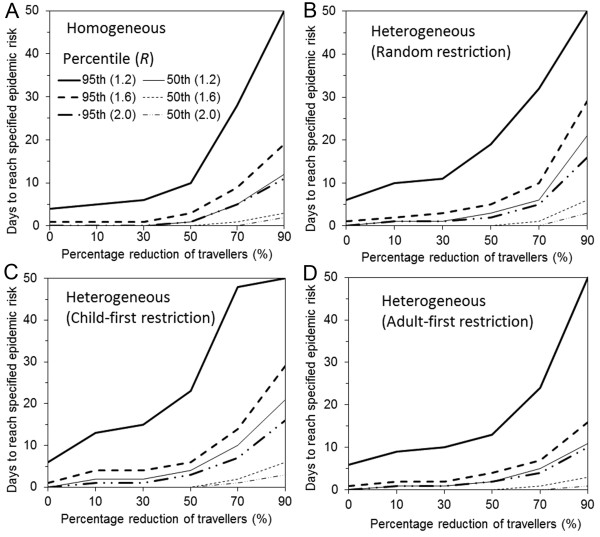
Figure 3.
Delay effect of travel restriction by selective and non-selective travel restrictions. The first day at which the probability of epidemic reaches 50% or 95% is examined as a function of the percentage reduction of travelers. In the absence of travel reduction, it is assumed that a total of 10 imported cases arrive every day and the importation continues for 50 days (with a total of 500 imported cases). The number of days with travel restriction minus that without restriction gives the delay in epidemic gained by the travel restriction policy. Three different reproduction numbers, 1.2 (solid line), 1.6 (dotted line) and 2.0 (dashed line) are considered. Scenarios A-D are the same as those in Figure 2 (A. homogeneously mixing population; B. random restriction in heterogeneously mixing population; C. child-first restriction and D. adult-first restriction in heterogeneously mixing population).

