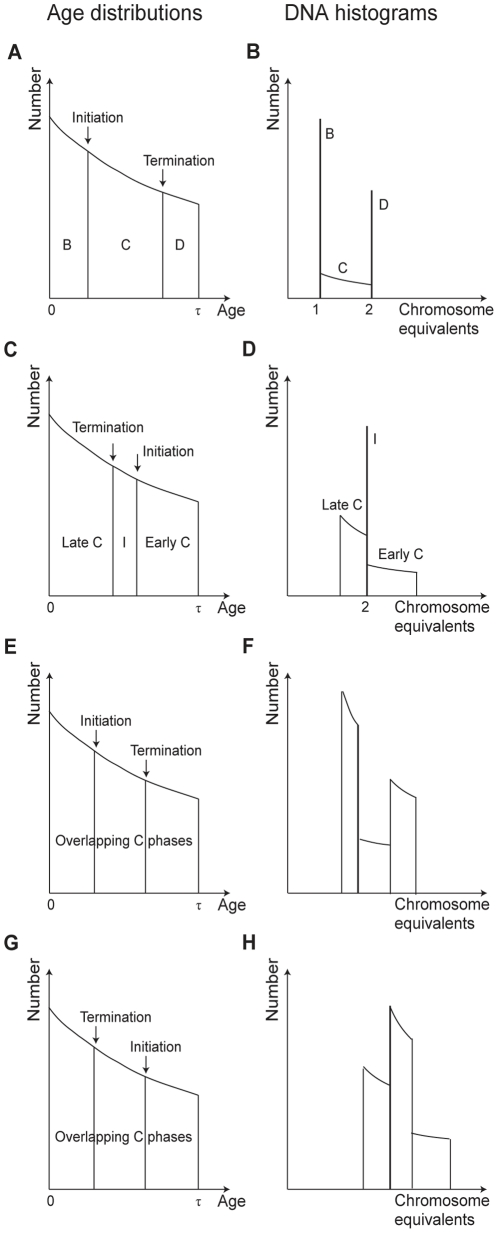
Figure 1. Age distributions and DNA histograms for theoretical cell populations.
(A) Illustration of the age distribution (number of cells as a function of cell age) for an exponentially growing cell population. The age spans from newborn, 0, to dividing cell, τ. Initiation and termination of DNA replication occurs at the indicated ages. (B) The corresponding DNA histogram will contain a lower number of cells per DNA interval for “older” cells. (C) The age distribution of cells with initiation of replication in the previous (“mother”) generation. For these cells C phase will continue through division, from Early C to Late C. (D) In the corresponding DNA histogram cells from the period between termination and initiation (I) will accumulate in a two chromosome peak. Cells from Early C have a higher total replication rate than cells in Late C and hence less cells per DNA interval. (E and G) Equivalent age distributions for two theoretical cell populations initiating replication in the “mother” and “grandmother” generation respectively. (F and H) Since the C phases overlap in both cases, no distinct peaks will accumulate in any of the DNA histograms. Due to different total replication rates, the numbers of cells per DNA interval will vary.

