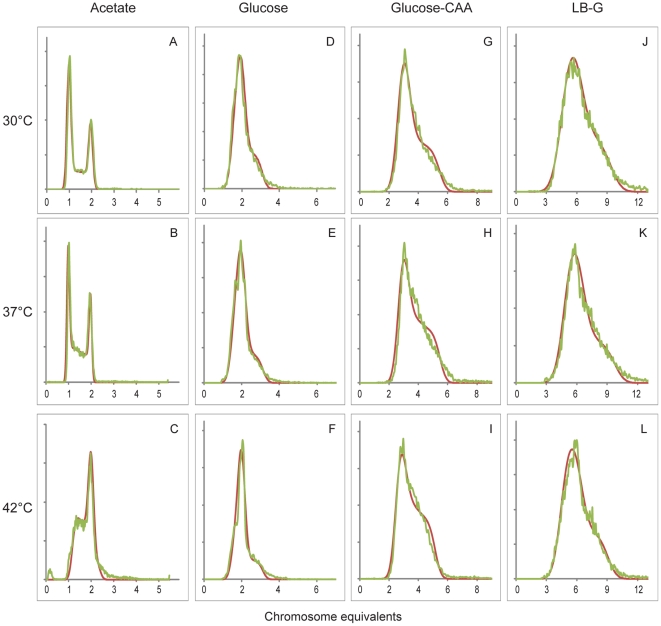
Figure 2. Simulations of DNA histograms to determine cell cycle parameters for Escherichia coli.
E. coli cultures were grown in four different media at three different temperatures, and samples were subjected to flow cytometry to obtain the experimental DNA distributions (green curves). By iteration of cell cycle parameters in our computer program best fit theoretical DNA histograms were found (red curves). One parallel of three is shown for each temperature for Acetate medium (A–C), Glucose medium (D–F), Glucose-CAA medium (G–I) and LB-G medium (J–L). The x-axes denote chromosome equivalents, and the scale is different from medium to medium.

