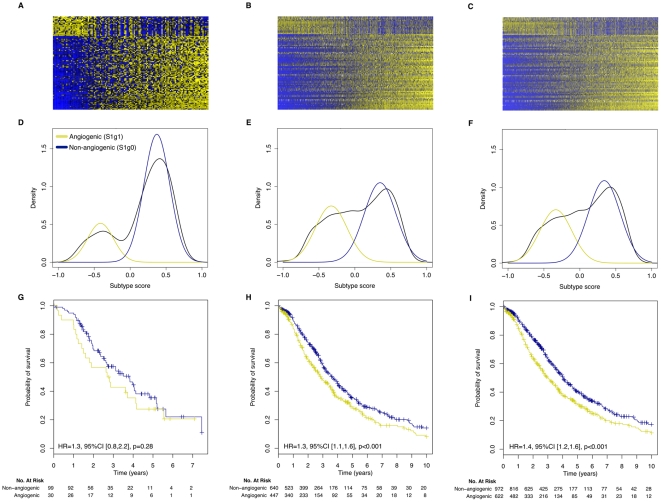
Figure 2. Validation of angiogenic ovarian cancer classification in our dataset and ten independent validation datasets.
Panels A, D and G display the gene expression of the 100 genes used to classify ovarian tumors into angiogenic and non-angiogenic subtypes in our dataset (129 patients), the high grade, late stage, serous tumors (1,090 patients) and all tumors (1,606 patients) in the validation set, respectively. Panels D, E and F report the corresponding distribution of the scaled subtype scores. Panels B, D and F reports the (overall) survival curves of patients having tumors of angiogenic or non-angiogenic subtype in the corresponding datasets.

