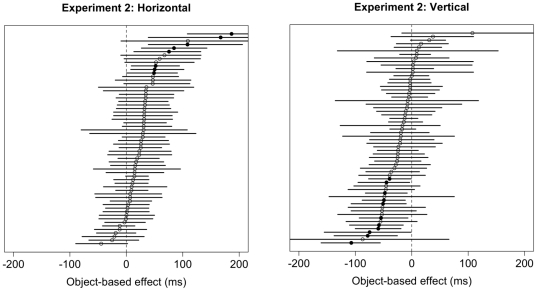
Figure 13. Distribution of mean differences between Invalid-different and Invalid-same trials and 95% confidence intervals for each subject in Experiment 2 for horizontal rectangles (left) and vertical rectangles (right).
Positive values are consistent with effects predicted by theories of object-based attention. Significant differences are denoted by filled circles; non-significant differences are shown with white circles.

