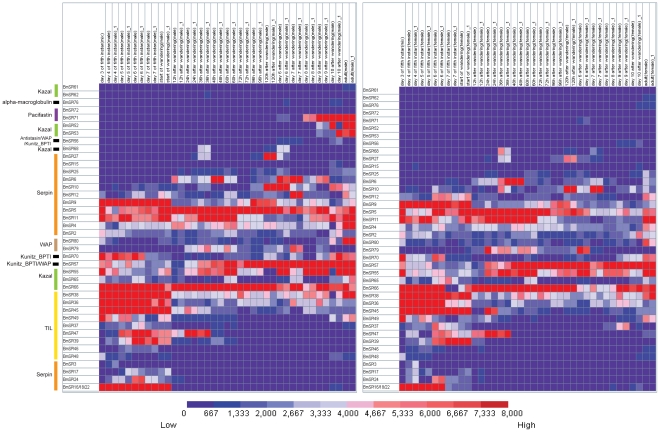
Figure 5. Expression profiles of SPI genes during different developmental stages.
Gene expression levels are represented by red (higher) and blue (lower) boxes. The columns represents twenty different sample time points: day 3, 4, 5, 6, 7 of the fifth instar, start of wandering, 12th, 24th, 36th, 48th, 60th, 72nd, 96th, 120th hour after wandering; day6, day7, day8, day9, day10 after wandering and adult. Word “mix” in the column name represents that the sample came from both gender; word “m” in the column name represents that the sample came from male silkworm; word “f” in the column name represents that the sample came from female silkworm.

