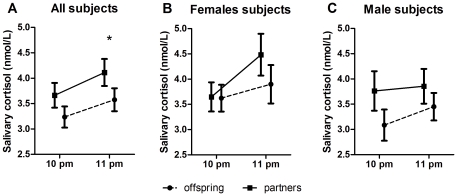
Figure 2. Evening cortisol in offspring and partners.
Evening cortisol. All three graphs present the mean cortisol level measured at the two time points. A) Evening cortisol in all offspring and partners. Analysis adjusted for age, gender, body mass index and current smoking habits. B) Evening cortisol in female offspring and partners. C) Evening cortisol in male offspring and partners. B,C) analysis adjusted for age, body mass index and current smoking habits. Data presented as means with the standard error of the mean (SEM). Statistical significance (p<0.05) denoted as an asterisk.

