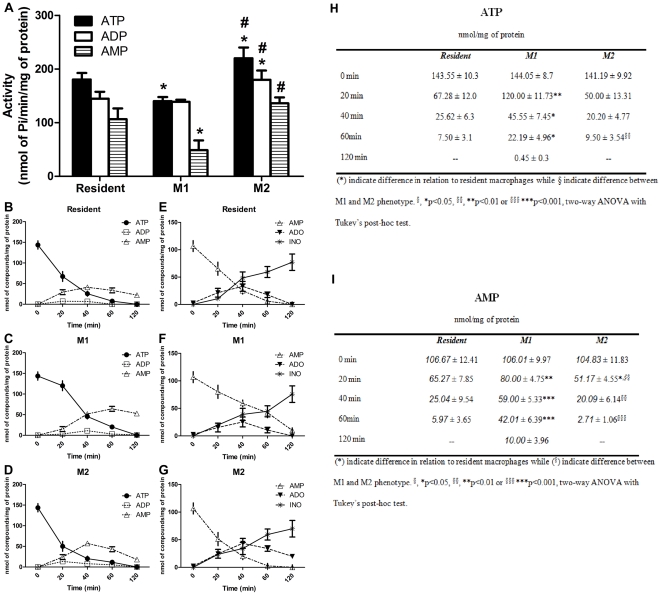
Figure 2. NTPDase activity on mouse macrophages after phenotype differentiation.
(A) Resident, M1 (stimulated with LPS) and M2 (stimulated with IL-4) macrophages were incubated in 48-well plates with ATP, ADP or AMP as described in Materials and Methods (section 2.5). Specific activity values were expressed as nmol Pi/min/mg protein. The data represent the mean ± S.D. (n = 5) with pooled macrophages from 6 to 8 mice per experiment carried out separately. Data were analyzed by ANOVA, followed by Tukey's test. (*) Significantly different from resident macrophages; (#) significantly different from LPS-stimulated macrophages (p<0.05). (B–D) Metabolism of extracellular ATP by HPLC; resident (B), M1 (stimulated with LPS) (C) and M2 (stimulated with IL-4) (D) macrophages were incubated in 48-well plates with 100 µM ATP in 200 µl of incubation medium as described in Material and Methods. An aliquot of the supernatant was withdrawn at 0, 20, 40, 60 and 120 min and the presence of ATP, ADP, AMP were determined. Data are mean ± SD values from three experiments in triplicates. (E–G) The same procedure utilized to evaluate the metabolism extracellular of ATP was used to AMP metabolism - adenosine (ADO) and inosine (INO) - Resident (E), M1 (stimulated with LPS) (F) and M2 (stimulated with IL-4) macrophages (G). Data are mean ± SD values from three experiments in triplicates. (H, I) Amount of nucleotides/nucleosides at different time of incubation. Data are mean ± SD values from three experiments in triplicates.

