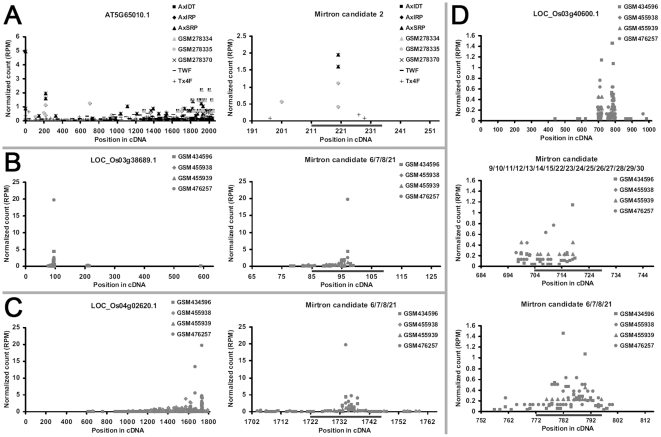
Figure 3. Degradome sequencing data-based identification of the targets of the mature mirtrons in Arabidopsis and rice.
For all the sub-figures (A to D), the first panels depict the degradome signals all along the target transcripts, and the other panels provide detailed views of the cleavage signals within the regions surrounding the target recognition sites (denoted by gray horizontal lines). The transcript IDs are shown in the first panels, and the mirtron IDs are listed in the other panels (see Table S3 and S4 for the sequence information corresponding to the mirtron IDs). The x axes measure the positions of the signals along the transcripts, and the y axes measure the signal intensities based on normalized counts (in RPM, reads per million), allowing cross-library comparison. See Table S2 for the degradome data sets used in this analysis.

