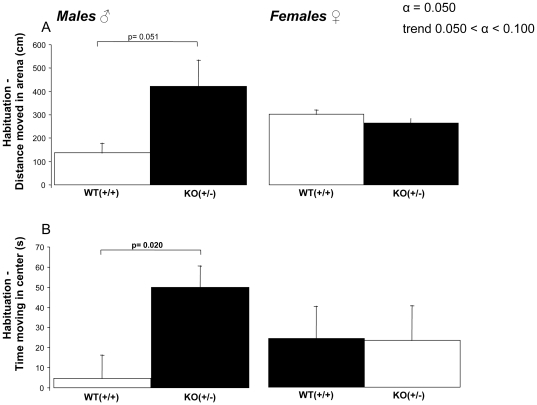
Figure 3. Habituation was described by the difference between trial 3 and trial 1, determined for the total distance moved in the open field (A) and the total time spend in the center of the open field test (B).
Error bars are standard errors of the mean. P-values of less than 0.050 shows significant effects, while p-values between 0.050 and 0.100 indicate a trend.

