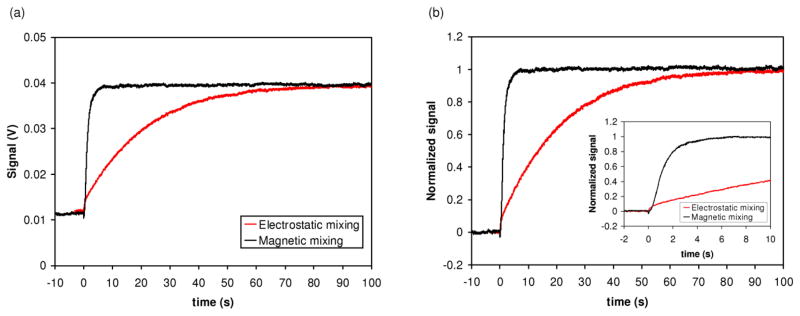
Fig. 3.
Comparison of rate of mixing for electrostatic mixing (i.e. mixing caused solely by the electrostatic merging of drops) and magnetic mixing. (a) FRET signal as measured by photomultiplier tube. Drops were merged at t=0 s. Magnetic mixing was performed at 1500 rpm. (b) Normalized data. The inlay shows the data for the first 10 seconds following the merge.

