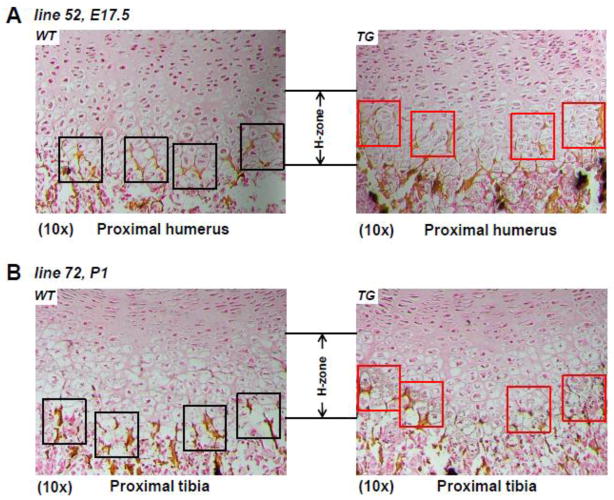
Fig 5. Increased mineralization in C ol10α1-TAP63α transgenic mice.
(A). Sagittal sections of proximal humerus from both TG and WT mouse embryos of line 52 at the E15.5 stage were subjected to von Kossa staining. More von Kossa staining (black and silver dots as well as dark brown staining) suggesting increased mineralization was shown in the hypertrophic zone of TG mice (right red squares) compared to WT littermate controls (left, black squares). (B). Von Kossa staining was also performed in sagittal sections of proximal tibia of both TG and WT littermates at P1 stage from transgenic mouse line 72. The results also suggest an earlier mineralization process in the middle hypertrophic zone of TG mice (right, red squares) compared to the WT littermate controls (left, black squares). H-zone: hypertrophic zone.

