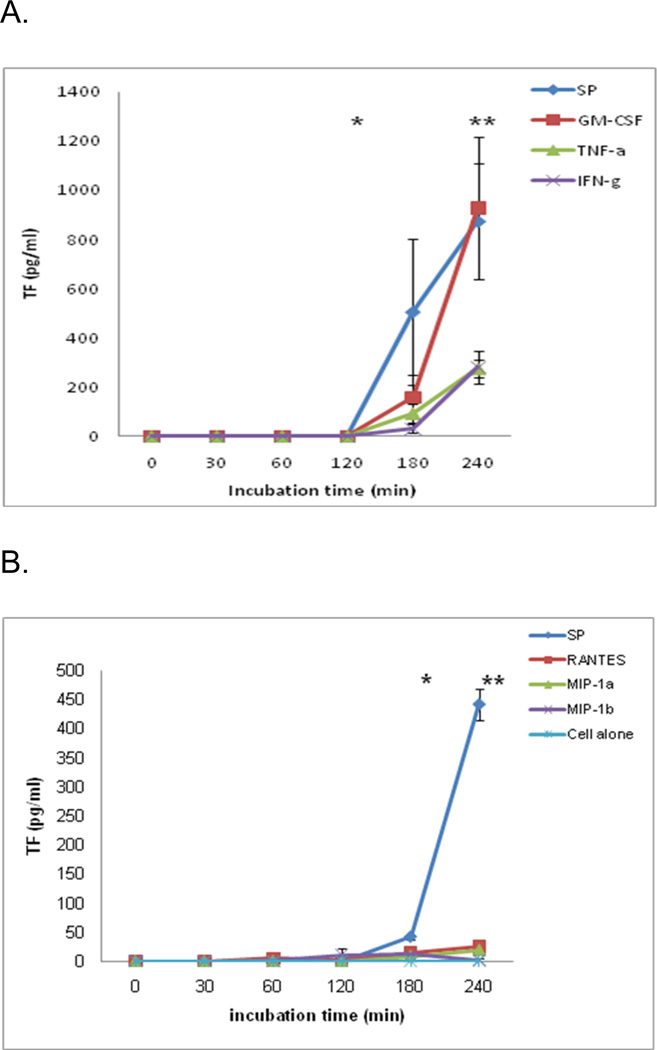
Figure 5. Effect of cytokines and chemokines on monocyte TF expression.
A. Maximum cytokine concentration that was released from monocytes by SP, using same concentrations, monocytes were stimulated by GM-CSF (9.06 pg/ml), IFN-γ (7.69 pg/ml) and TNF-α (2.19 ng/ml). Each of the cytokines had stimulated monocyte to express TF as indicated. The data shown are the mean ± SEM of triplicate and are representative of three experiments. * p<0.05 represents 2 vs 3 h and 3 vs. 4 h of SP; **, p<0.001 represents GM-CSF, IFNγ and TNFα treated vs. SP at 4h and not significant (none) as indicated.
B. Maximum chemokine concentration that was released from monocytes by SP, using same concentrations, monocytes were stimulated by chemokines: MIP-1α (7.21ng/ml), MIP-1α (48.16 ng/ml), and RANTES (1.2 ng/ml). Each of the chemokines had stimulated monocyte to express TF as indicated. The data are the mean ± SEM of triplicate and are representative of three experiments.
* p<0.01 represents 3 h vs. 4 h of SP; **, p<0.001 represents MIP-1α, MIP-1β and RANTES treated vs. SP at 4h and not significant (none) as indicated.

