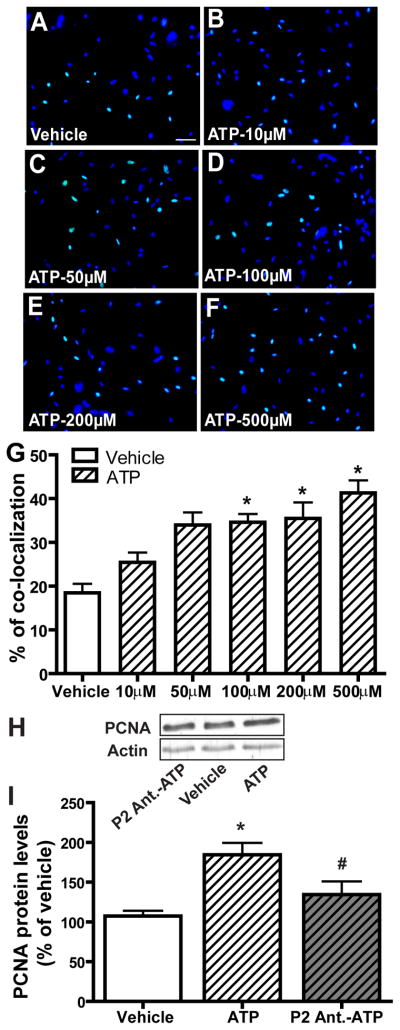
Figure 1. ATP increases cell proliferation in OE primary cell culture via activation of P2 purinergic receptors.
(A–G) ATP dose-dependently increases cell proliferation in OE primary cell culture. OE primary cell cultures were incubated with saline vehicle or ATP (10, 50, 100, 200 or 500 μM) for 2 hours and then subjected to the EdU incorporation assay. (A–F) Representative images of EdU incorporation (green) and DAPI nuclear staining (blue) for each treatment are shown. Scale bar = 25 μm. (G) Quantification of EdU and DAPI co-localization from 3–5 non-overlapping fields of view per replication. Each treatment had 3–5 replications. * indicates significant differences from vehicle at p < 0.05 or 0.01. (H–I) OE primary cell cultures were pre-treated with saline vehicle or P2 purinergic receptor antagonists, PPADS (25 μM) and suramin (100 μM) 30 minutes prior to incubation with saline vehicle or ATP (100 μM) for 2 hours. (H) Representative immunoblots of PCNA and actin. (I) Quantification of PCNA levels from three replications. The levels of PCNA are normalized to actin and data are expressed as a ratio to saline vehicle. * indicates a significant difference from vehicle at p<0.01. # indicates a significant difference from ATP at p < 0.05 (one-way ANOVA followed by Newman-Keuls post hoc test).

