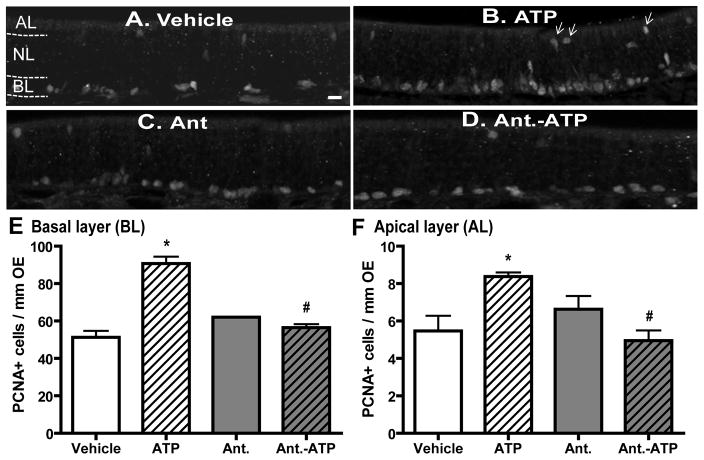
Figure 2. ATP activation of P2 purinergic receptors increases basal and apical cell proliferation in mouse OE in vivo.
Mice were intranasally instilled with saline vehicle (A–B) or P2 purinergic receptor antagonist, PPADS (50 nmoles/kg) and suramin (200 nmoles/kg), (C–D) 30 min prior to saline vehicle (A and C) or ATP (400 nmoles/kg, B and D) and tissue was collected 48 hours post-instillation of ATP. (A–D) Representative images of PCNA immunostaining. Dotted white line depicts the apical (AL), neuron (NL) and basal layer (BL). Arrows indicate PCNA+ cells in the apical layer. Scale bar = 5 μm. (E–F) Quantification of PCNA+ cells in the basal (E) and apical (F) layer of OE (n = 12 sections from 4 mice/group). * indicates significant differences from vehicle at p < 0.05. # indicates significant differences from ATP at p < 0.01 (two-way ANOVA followed by Newman-Keuls post hoc test).

