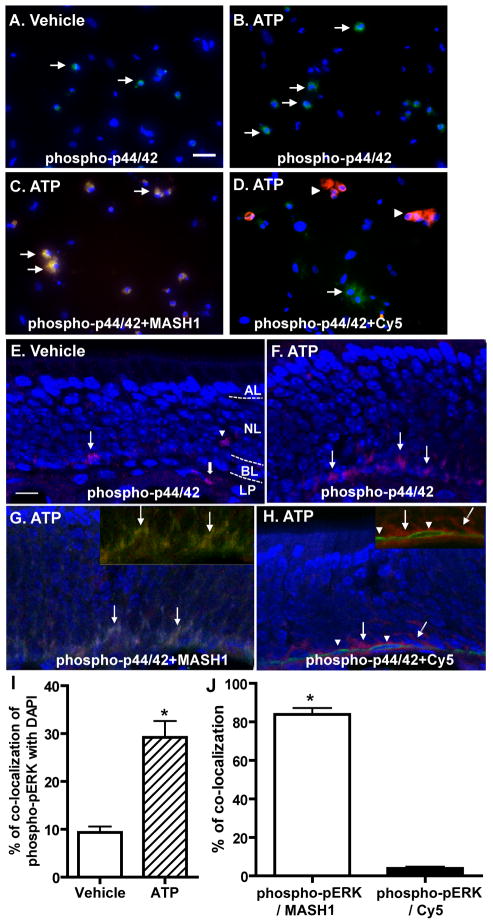
Figure 4. ATP induces activation of p44/42 ERK in GBCs but not HBCs in vitro and in vivo.
(A–D) OE primary cell cultures were incubated with (A) saline vehicle or (B–D) ATP (100 μM) for 30 min. Representative images of phospho-p44/42 ERK immunoreactivity (green) alone (A–B) or co-localized with globose basal cell marker, MASH1 (red, C) or horizontal basal cell marker, cytokeratin 5 (red, D) are shown. Nuclei were counterstained with DAPI (blue). Arrows in A, B and D indicate cells with phospho-p44/42 ERK immunoreactivity and arrows in C indicate co-localization of phospho-p44/42 ERK with MASH1. Arrowheads in D indicate cytokeratin 5 immunoreactive cells. Scale bar = 25 μM. (E–H) Mice were intranasally instilled with (E) saline vehicle or (F–H) ATP (400 nmoles/kg) and tissues were collected 1 hour post-instillation of ATP. Representative images of phospho-p44/42 ERK immunoreactivity (red) alone (E–F) or co-localized with globose basal cell marker, MASH1 (green, G) or horizontal basal cell marker, cytokeratin 5 (green, H) are shown. Nuclei were counterstained with DAPI (blue). Dotted white line depicts the apical (AL), neuron (NL), basal layer (BL) and lamina propria (LP). The inserted images in upper right corner show the co-localization of phospho-p44/42 (green) with MASH1 (red, G) but not cytokeratin 5 (red, H) without DAPI staining. Arrows in E, F and H indicate immunoreactivity of p44/42 ERK in the basal layer of OE. Arrowhead in E indicates the positive staining of p44/42 ERK located in OSN layer. Thick arrow in E indicates the positive staining of p44/42 in lamina propria. Arrows in G indicate the co-localization of phospho-p44/42 ERK with MASH1. Arrowheads in H indicate cytokeratin 5 immunoreactive cells. Scale bar = 10 μM. (I) Quantification of co-localization of phospho-pERK with DAPI in vehicle- and ATP-treated cells. (J) Quantification of co-localization of phospho-pERK with MASH1 or Cy5 in ATP-treated cells. The co-localization was analyzed from 3–5 non-overlapping fields of view per replication. Each treatment had 3 replications. * indicates significant differences at p < 0.01 (Student’s t test).

