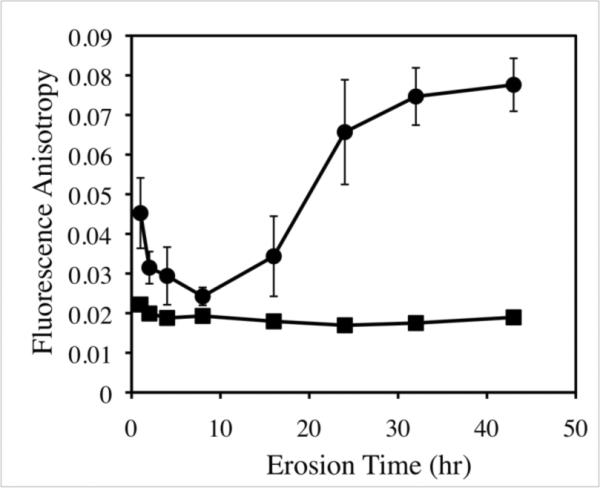
Figure 5.

Plot of fluorescence anisotropy versus time measured for polymer 1TMR released from polymer 1TMR/DNA films incubated in PBS buffer at 37 °C (circles) and a solution of 40 μg polymer 1TMR alone (squares) incubated in PBS buffer at 37 °C in the absence of DNA (see text for details). Fluorescence anisotropy values of solutions for polymer 1TMR/DNA film erosion are representative of polymer 1TMR released over discrete time intervals (i.e. 0 – 1 hours, 1 – 2 hours, 2 – 4 hours, etc.; see text for details). The 40 μg samples of polymer 1TMR were incubated in solution for the entirety of the experiment in order to provide fluorescence anisotropy values that are reflective of polymer 1TMR released from films (since the polymer within films can continually degrade due to hydrolysis).
