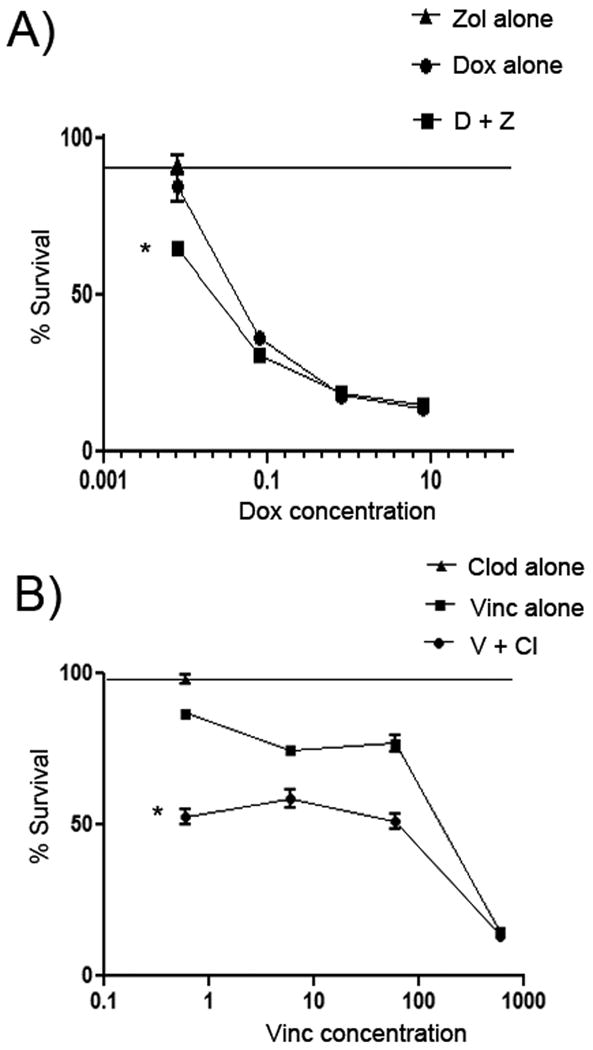
Figure 3. Dose response curves for determination of drug interactions between zoledronate and doxorubicin or between clodronate and vincristine.

In (A), dose response curves were generated for DH82 cells treated with zoledronate, doxorubicin, or zoledronate plus doxorubicin in order to compare drug interactions via Bliss analysis. Cell viability was significantly reduced in cells treated with zoledronate (0.2 μg/mL) and increasing doses of doxorubicin, compared to cells treated with zoledronate alone (0.2 μg/mL) or increasing doses of doxorubicin alone, as assessed by Bliss analysis. In (B), a similar analysis was conducted using DH82 cells treated with clodronate (5 μg/mL) alone, with clodronate (5 μg/mL) plus increasing doses of vincristine, or with increasing doses of vincristine alone. The viability of MH cells was found using Bliss analysis to be significantly reduced in cells treated with the combination of clodronate and vincristine. (* = p < 0.05)
