Figure 3.

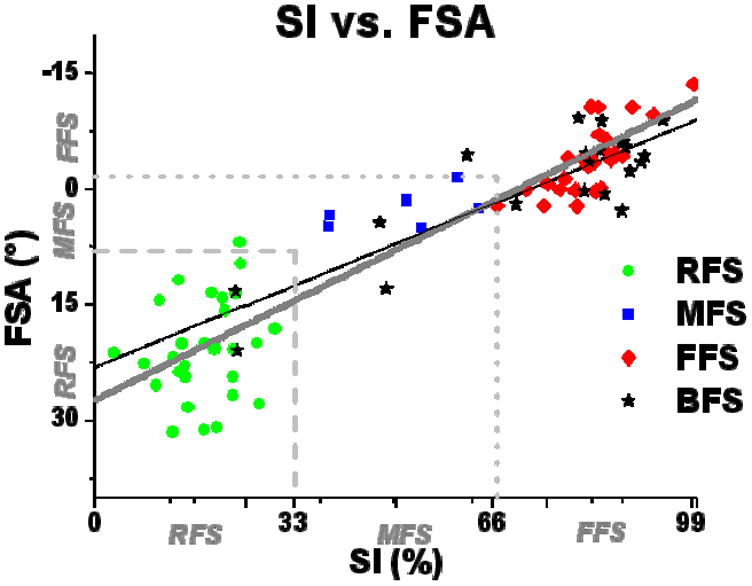
Regression model of SI vs. FSA. Each of the 20 subjects were tested in all 4 conditions, thus, there are 60 shod data points (20 RFS, 20 MFS and 20 FFS determined by visual inspection), and 20 barefoot data points.

Regression model of SI vs. FSA. Each of the 20 subjects were tested in all 4 conditions, thus, there are 60 shod data points (20 RFS, 20 MFS and 20 FFS determined by visual inspection), and 20 barefoot data points.