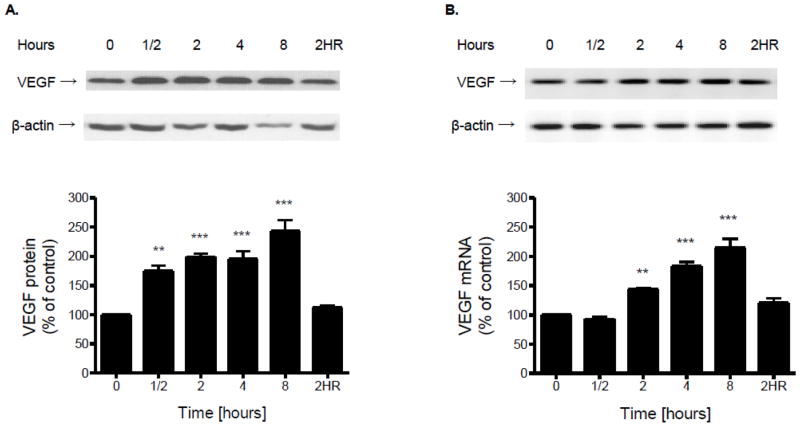
Figure 2.
Confluent brain microvascular endothelial cell cultures were subjected to hypoxia (1% O2) for various periods of time. (A) Total protein was extracted and resolved using SDS-PAGE. VEGF or β-actin protein was detected by Western blot probed with corresponding antibodies. Protein or mRNA levels of VEGF were determined by normalizing the densities of their bands to those of β-actin. (B) Total RNA was extracted, reverse transcribed and amplified with gene specific primers for VEGF or β-actin. Data in the bottom panel are the means ± SD of 3 experiments and expressed as percent of untreated control. 2HR: 2 h hypoxia followed by 2 h reoxygenation. **p<0.01, ***p <0.001 vs. 0 h.

