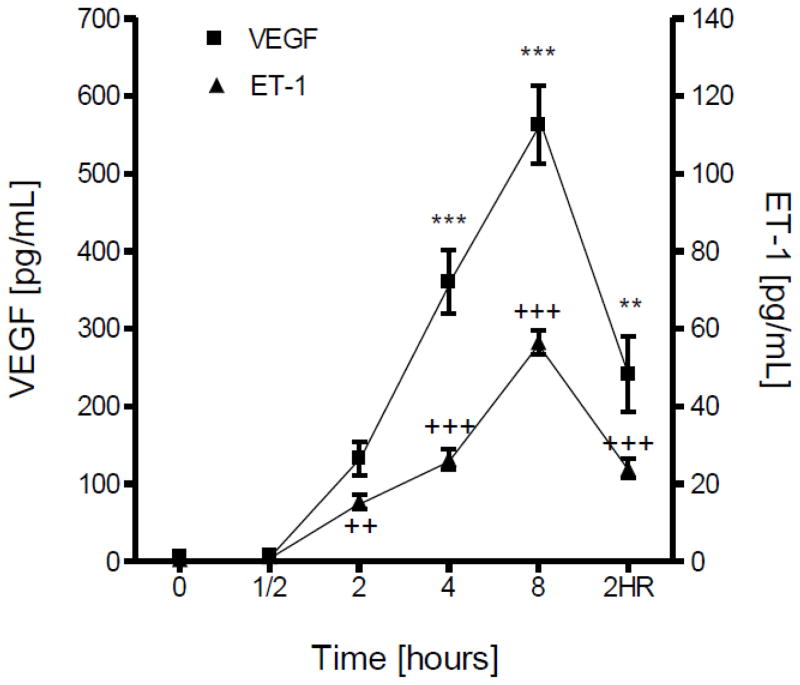
Figure 3.
Confluent brain microvascular endothelial cell cultures were subjected to hypoxia (1% O2) for various periods of time. ELISA was performed to determine VEGF or ET-1 concentration (pg/ml) in the culture medium. The amount of induced VEGF or ET-1 by hypoxia was compared to normoxia control cultures at the same time points. Results are means ± SD of 3 experiments performed in triplicate. 2HR: 2 h hypoxia followed by 2 h reoxygenation. **/++p<0.01, ***/+++p <0.001 vs. 0 h.

