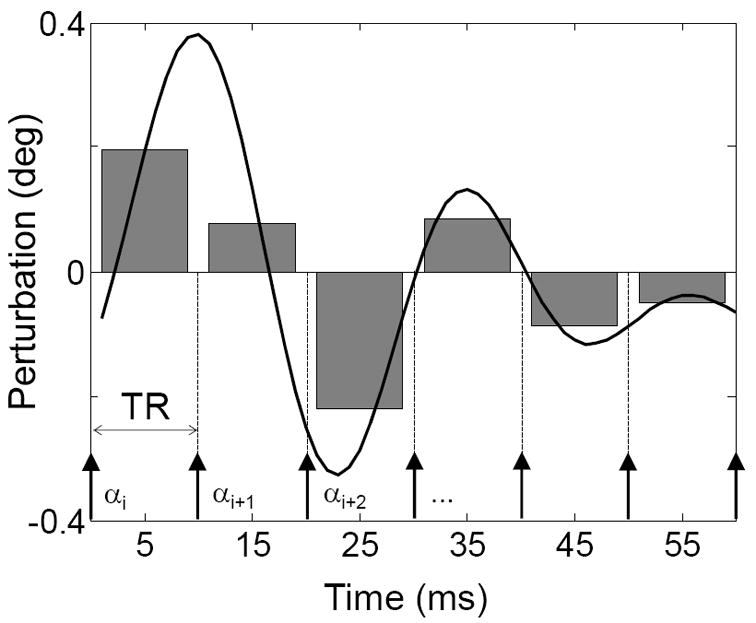
Figure 1.

The conceptual basis of the MASS method. The continuous line represents the time course of the spin phase perturbation (in deg) induced by a ΔBz–perturbing function F, such as neuronal current induced spin phase perturbation. Arrows below represent RF pulses. The waveform of duration TW=N·TR ≤T2 is repeated periodically so that magnetization evolves into a dynamic steady state (i.e. multiple alternating states). The grey bars represent the mean perturbation value between successive excitation (RF) pulses. In this example there are N=6 distinct mean values proportional to the integral of ΔBz(i) over an interval τ=[nTR,(n+1)TR]. RF pulses of α deg flip angle are phase cycled using a 180 deg step.
