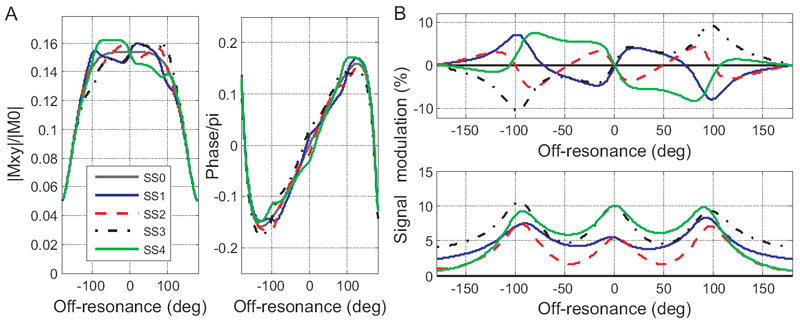
Figure 2.

MASS off-resonance profiles. A: Magnitude (left) and phase (right) of transverse magnetization as a function of static off-resonance for four steady states (SSi, i=[1,4]). The steady states are induced by the waveform δφj ≈ [0,5,−2.5,−1.25] deg (A,B). The gray continuous line in A plots no-modulation state SS0, other states are as in legend. The corresponding signal modulation off-resonance profiles during the 4 states (difference between SSi and the SS0 in % of SS0) are plotted in B: the top panel plots relative “difference of magnitudes” and the bottom panel plots relative “magnitude of difference” (see text for definitions). Simulation parameters are as in experiment (see below): T1/T2 = 800/60ms, TR/TE=20/2.6 ms, flip angle 30 deg.
