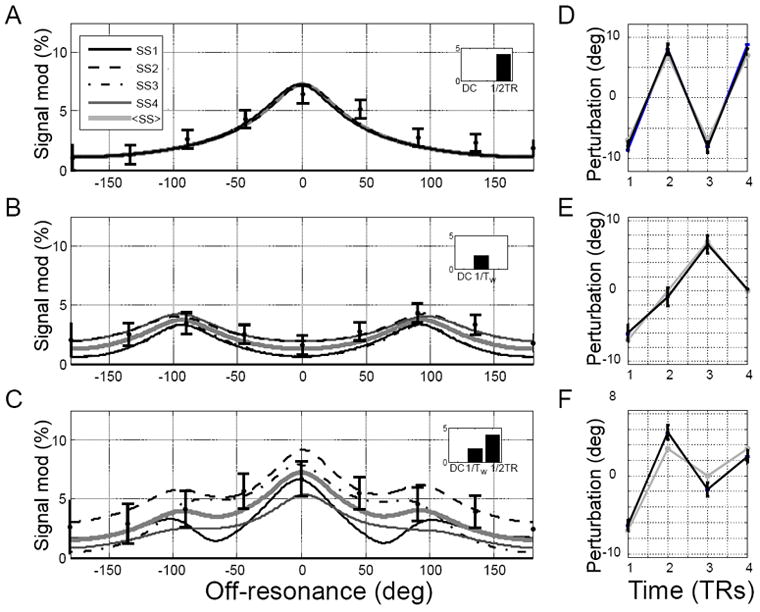
Figure 4.

Simulated and experimental steady state modulation profiles as a function of the frequency content of the driving waveform and estimated waveforms. A,B: the magnitude of complex difference modulation profiles induced by waveforms containing only one frequency. Insets represent DFT of the driving waveforms. A: Modulation profiles induced by a waveform alternating at the rate 1/2TR with perturbations δφj ≈ [−5,5,−5,5] deg; B: modulation profiles induced by a waveform alternating at the rate 1/4TR=1/Tw with δφj ≈ [−5,0,5,0] deg; C: modulation profiles induced by a waveform equal to the mean of the top two waveforms δφj ≈ [−5,2.5,0,2.5] deg and thus containing 2 frequencies. The gray thick lines are the mean across simulated states, and the filled circles with error bars represent the measured mean and standard deviation of MASS responses from the phantom experiment. D-E: waveforms estimated from 4 consecutive voxels ~23mm from wire. Black lines are estimated wavefrom values and error bars represent standard deviation of the posterior distributions; gray lines represent the nominal waveforms.
