Figure 2.
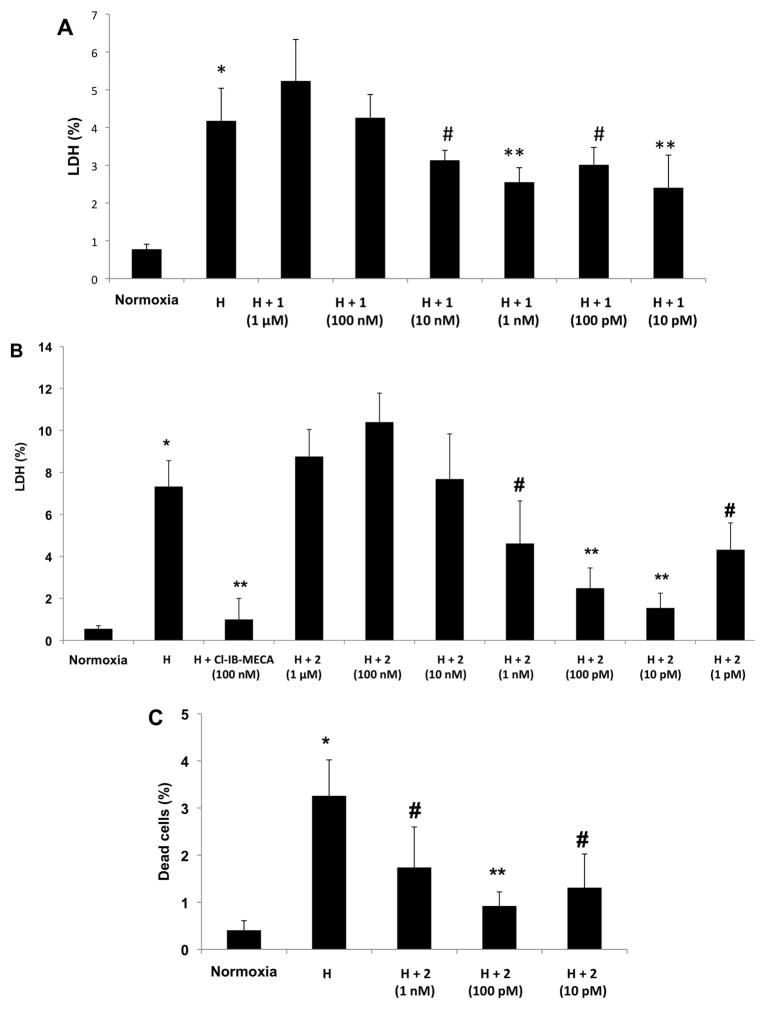
A. Effects of conjugate 1 on cardiomyocytes subjected to hypoxia. Cardiomyocytes were treated with 1 at concentrations of 1 μM, 100 nM, 10 nM, 1 nM, 100 pM, 10 pM, and exposed to hypoxia (H). LDH released to the medium was determined immediately after hypoxia. 100% activity was the total LDH activity in homogenate of untreated cells. * P<0.001 compared to normoxia. ** P<0.001 compared to hypoxia; # P<0.05 compared to hypoxia. B., C. Effects of conjugate 2 on cardiomyocytes subjected to hypoxia. Cardiomyocytes were treated with 2 at concentrations of 1 μM, 100 nM, 10 nM, 1 nM, 100 pM, 10 pM, 1 pM, and exposed to hypoxia (H). (B) LDH released to the medium was determined immediately after hypoxia. 100% activity was the total LDH activity in homogenate of untreated cells. (C) Percent of dead cells determined by PI staining. 100% is the number of cells in each well. * P<0.001 compared to normoxia. ** P<0.001 compared to hypoxia. # P<0.05 compared to hypoxia.

