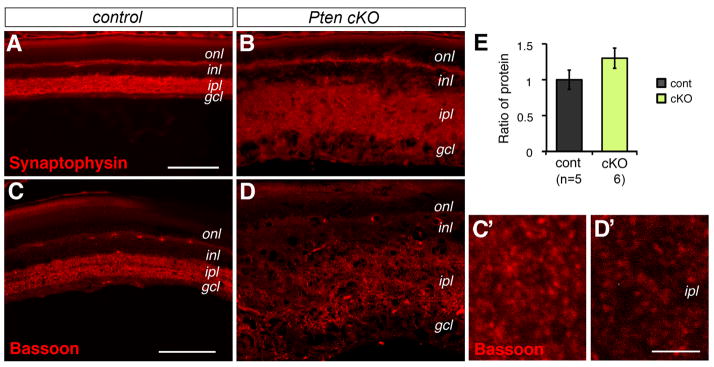
Figure 7. Pten mutant retina permits synaptogenesis in the inner plexiform layer.
(A–D) Confocal images of immunolabeled control (A, C) and Pten cKO (B, D) retinas at P18 with synaptic markers Synaptophysin (A, B) and presynatic protein Bassoon (C, D). (C′, D′) show higher magnification images of the inner plexiform layer. Pten mutant retinas show the presence of Basson-labeled synaptic densities.
(E) Quantification of bassoon protein by Western blots at P18 did not detect significant change of total Bassoon protein levels (Individual retinas analyze (n) are indicated below the bar graphs. Mean ± S.E.M.
gcl, ganglion cell layer; inl, inner nuclear layer; ipl, inner plexiform layer; onl, outer nuclear layer. Scale bars, A for (A, B), 100 μm; C for (C, D), 75 μm; C′ for (C′, D′), 5 μm.

